Data Interpretation questions test one's ability in analysing data, inspecting the elements in data and interpreting them to extract maximum information from the given set of data or information. The data is usually given in the form of charts, tables and graphs.
Practise with our Data Interpretation questions and answers to help you know what to expect, improve your speed and confidence and be really prepared for the actual test.
In a school the periodical examination are held every second month. In a session during April 2001 - March 2002, a student of Class IX appeared for each of the periodical exams. The aggregate marks obtained by him in each perodical exam are represented in the line-graph given below.
Marks Obtained by student in Six Periodical Held in Every Two Months During the Year in the Session 2001 - 2002.
Maximum Total Marks in each Periodical Exam = 500
73.25%
75.5%
77%
78.75%
Correct answer is B
Required percentage = [ (370 + 385)/(500 + 500) x 100 ] % = ( 755/1000 x 100 ) % = 75.5%.
In a school the periodical examination are held every second month. In a session during April 2001 - March 2002, a student of Class IX appeared for each of the periodical exams. The aggregate marks obtained by him in each perodical exam are represented in the line-graph given below.
Marks Obtained by student in Six Periodical Held in Every Two Months During the Year in the Session 2001 - 2002.
Maximum Total Marks in each Periodical Exam = 500
110%
112.5%
115%
116.5%
Correct answer is B
Here it is clear from the graph that the student obtained 360, 365, 370, 385, 400 and 405 marks in periodical exams held in Apr 01, Jun 01, Aug 01, Oct 01, Dec 01 and Feb 02 respectively.
Required percentage = ( 405/360 x 100 ) % = 112.5%
In a school the periodical examination are held every second month. In a session during April 2001 - March 2002, a student of Class IX appeared for each of the periodical exams. The aggregate marks obtained by him in each perodical exam are represented in the line-graph given below.
Marks Obtained by student in Six Periodical Held in Every Two Months During the Year in the Session 2001 - 2002.
Maximum Total Marks in each Periodical Exam = 500
June, 01
August, 01
Oct, 01
Dec, 01
Correct answer is C
Percentage increase in marks in various periodical exams compared to the previous exams are:
For Jun 01 = [ (365 - 360)/360 x 100 ] % = 1.39%.
For Aug 01 = [ (370 - 365)/365 x 100 ] % = 1.37%.
For Oct 01 = [ (385 - 370)/370 x 100 ] % = 4.05%.
For Dec 01 = [ (400 - 385)/385 x 100 ] % = 3.90%.
For Feb 02 = [ (404 - 400)/400 x 100 ] % = 1.25%.
Clearly, highest percentage increase in marks is in Oct 01.
Study the following line graph which gives the number of students who joined and left the school in the beginning of year for six years, from 1996 to 2001.
Initial Strength of school in 1995 = 3000.
Among the given years, the largest number of students joined the school in the year?
1996
1998
2001
2000
Correct answer is C
As calculated above, the largest number of students (i.e., 550) joined the school in the year 2001
Study the following line graph which gives the number of students who joined and left the school in the beginning of year for six years, from 1996 to 2001.
Initial Strength of school in 1995 = 3000.
During which of the following pair of years was the strength of the school same?
1999 and 2001
1998 and 2000
1997 and 1998
1996 and 2000
Correct answer is D
As calculated above, in the years 1996 and 2000 the strength of the school was same i.e., 3100.
Study the following line graph which gives the number of students who joined and left the school in the beginning of year for six years, from 1996 to 2001.
Initial Strength of school in 1995 = 3000.
92.13%
93.75%
96.88%
97.25%
Correct answer is B
Required percentage = ( 3000/3200 x 100 ) % = 93.75%
Study the following line graph which gives the number of students who joined and left the school in the beginning of year for six years, from 1996 to 2001.
Initial Strength of school in 1995 = 3000.
The strength of the school incresed/decreased from 1997 to 1998 by approximately what percent?
1.2%
1.7%
2.1%
2.4%
Correct answer is B
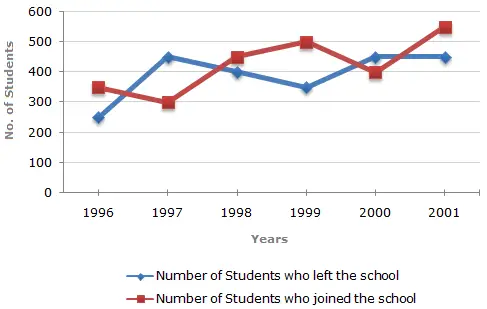
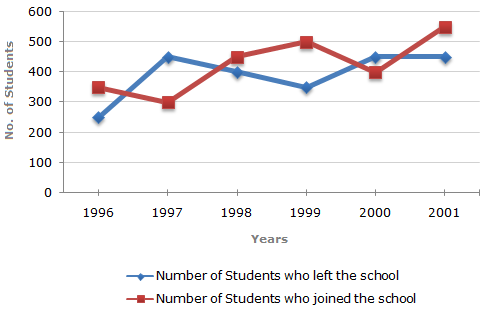
Important data noted from the given graph:
In 1996 : Number of students left = 250 and number of students joined = 350.
In 1997 : Number of students left = 450 and number of students joined = 300.
In 1998 : Number of students left = 400 and number of students joined = 450.
In 1999 : Number of students left = 350 and number of students joined = 500.
In 2000 : Number of students left = 450 and number of students joined = 400.
In 2001 : Number of students left = 450 and number of students joined = 550.
Therefore, the numbers of students studying in the school (i.e., strength of the school) in various years:
In 1995 = 3000 (given).
In 1996 = 3000 - 250 + 350 = 3100.
In 1997 = 3100 - 450 + 300 = 2950.
In 1998 = 2950 - 400 + 450 = 3000.
In 1999 = 3000 - 350 + 500 = 3150.
In 2000 = 3150 - 450 + 400 = 3100.
In 2001 = 3100 - 450 + 550 = 3200.
Percentage increase in the strength of the school from 1997 to 1998
= [ (3000 - 2950)/2950 x 100 ] % = 1.69% ≈ 1.7%.
Study the following line graph which gives the number of students who joined and left the school in the beginning of year for six years, from 1996 to 2001.
Initial Strength of school in 1995 = 3000.
1997
1998
1999
2000
Correct answer is A
The percentage rise/fall in the number of students who left the school (compared to the previous year) during various years are:
For 1997 = [ (450 - 250)/250 x 100 ] % = 80% (rise).
For 1998 = [ (450 - 400)/450 x 100 ] % = 11.11% (fall).
For 1999 = [ (400 - 350)/400 x 100 ] % = 12.5% (fall).
For 2000 = [ (450 - 350)/350 x 100 ] % = 28.57% (rise).
For 2001 = [ (450 - 450)/450 x 100 ] % = 0%.
Clearly, the maximum percentage rise/fall is for 1997.
Study the following line graph which gives the number of students who joined and left the school in the beginning of year for six years, from 1996 to 2001.
Initial Strength of school in 1995 = 3000.
The number of students studying in the school during 1999 was?
2950
3000
3100
3150
Correct answer is D
As calculated above, the number of students studying in the school during 1999 = 3150.
Information and Communication Manager at Nigerian Breweries Plc
Area Sales Manager at Airtel Nigeria
State Business Manager at Airtel Nigeria
Regional Technical Officer at Airtel Nigeria
Business Manager at Airtel Nigeria
Contract Administrator at Robert Walters
Import & Export Manager at Kerildbert Holdings Limited
JV Account Payable Officer at WTS Energy