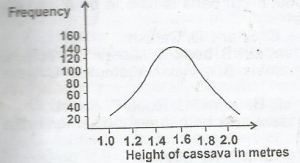
The graph illustrates
...Use the diagram below to answer this question.

The graph illustrates
the highest frequency for a height of 2 metres
a discontinuously varying character
a continuously varying character
total yield in a cassava farm
Correct answer is C
No explanation has been provided for this answer.
Similar Questions
The function of the villi in the alimentary canal is to ...
The inheritable characters that are determined by a gene located on the X-chromosome is ...
The kidneys of all vertebrates act as osmoregulators. This means that they ...
The part of the brain that controls heart beat and breathing is the ...
In mammalian development, the function of the yolk is to ...
Which of the following organisms will have the highest biomass? ...
In the nucleus of a cell, the thread-like structure in which genes are embedded is ...
Which of the following essential substance is contained in vegetable? ...
Which is the most ecologically viable method of insect pest control? ...