Data Interpretation questions test one's ability in analysing data, inspecting the elements in data and interpreting them to extract maximum information from the given set of data or information. The data is usually given in the form of charts, tables and graphs.
Practise with our Data Interpretation questions and answers to help you know what to expect, improve your speed and confidence and be really prepared for the actual test.
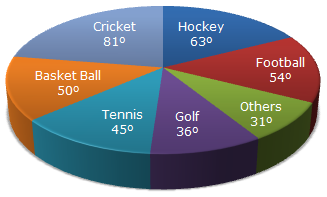
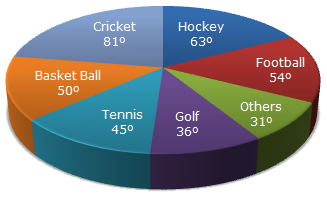
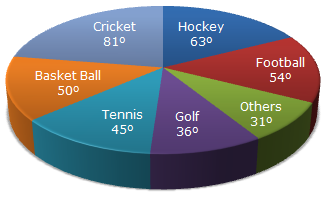
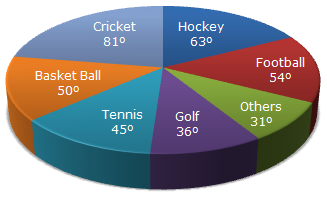
The circle-graph given here shows the spendings of a country on various sports during a particular year. Study the graph carefully and answer the questions given below it.
Rs. 800,000
Rs. 8,000,000
Rs. 12,000,000
Rs. 16,000,000
Correct answer is B
Amount spent on Cricket and Hockey together = Rs. [ (81 + 63)/360 x 2 ] crores
= Rs. 0.8 crores
= Rs. 8,000,000
The circle-graph given here shows the spendings of a country on various sports during a particular year. Study the graph carefully and answer the questions given below it.
How much percent less is spent on Football than that on Cricket?
22 2⁄9%
27%
33 1⁄3%
37 1⁄7%
Correct answer is C
Let the total spendings on sports be Rs. x
Then, Amount spent on Cricket = Rs. ( 81/360 x x ) = Rs. 9x/40
Amount spent on Football = Rs ( 54/360 x x ) = Rs. 3x/20
Difference = Rs. ( 9x/40 - 3x/20 ) = Rs 3x/40
Therefore Required percentage = Rs. [ ((3x/40)/(9x/40)) x 100 ] % = 33 1⁄3 %
The circle-graph given here shows the spendings of a country on various sports during a particular year. Study the graph carefully and answer the questions given below it.
Rs. 250,000
Rs. 360,000
Rs. 375,000
Rs. 410,000
Correct answer is A
Amount spent on Basketball exceeds that on Tennis by:
Rs. ( (50 - 45)/360 x 18,000,000 ) = Rs. 250,000
The circle-graph given here shows the spendings of a country on various sports during a particular year. Study the graph carefully and answer the questions given below it.
How much percent more is spent on Hockey than that on Golf?
27%
35%
37.5%
75%
Correct answer is D
Let the total spendings on sports be Rs. x. Then,
Amount spent on Golf = Rs. ( (36/360) x x ) = Rs. x/10
Amount spent on Hockey = Rs ( (63/360) x x ) = Rs. 7x/40
Difference = Rs. ( 7x/40 - x/10 ) = Rs 3x/40
Therefore Required percentage = Rs. [ (3x/40)/(x/10) x 100 ] % = 75%.
The circle-graph given here shows the spendings of a country on various sports during a particular year. Study the graph carefully and answer the questions given below it.
What percent of total spending is spent on Tennis?
12 1⁄2%
22 1⁄2%
25%
45%
Correct answer is A
Percentage of money spend on Tennis = ( (45/360) x 100 ) % = 12 1⁄2%
The following pie-charts show the distribution of students of graduate and post-graduate levels in seven different institutes in a town.
Distribution of students at graduate and post-graduate levels in seven institutes:
Total number of students studying at post-graduate level from institutes N and P is
5601
5944
6669
8372
Correct answer is C
Required number = (15% of 24700) + (12% of 24700)
= 3705 + 2964
= 6669
The following pie-charts show the distribution of students of graduate and post-graduate levels in seven different institutes in a town.
Distribution of students at graduate and post-graduate levels in seven institutes:
13 : 19
21 : 13
13 : 8
19 : 13
Correct answer is D
Required ratio = (21% of 24700)/(13% of 27300) = (21 x 24700)/(13 x 27300) = 19/13
The following pie-charts show the distribution of students of graduate and post-graduate levels in seven different institutes in a town.
Distribution of students at graduate and post-graduate levels in seven institutes:
How many students of institutes of M and S are studying at graduate level?
7516
8463
9127
9404
Correct answer is B
Students of institute M at graduate level= 17% of 27300 = 4641.
Students of institute S at graduate level = 14% of 27300 = 3822.
Therefore Total number of students at graduate in institutes M and S = (4641 + 3822)
= 8463
The following pie-charts show the distribution of students of graduate and post-graduate levels in seven different institutes in a town.
Distribution of students at graduate and post-graduate levels in seven institutes:
14 : 19
19 : 21
17 : 21
19 : 14
Correct answer is D
Required ratio = (21% of 24700)/(14% of 27300) = (21 x 24700)/14 x 27300 = 19/14
The following pie-charts show the distribution of students of graduate and post-graduate levels in seven different institutes in a town.
Distribution of students at graduate and post-graduate levels in seven institutes:
What is the total number of graduate and post-graduate level students in institute R?
8320
7916
9116
8099
Correct answer is D
Required number = (17% of 27300) + (14% of 24700)
= 4641 + 3458
= 8099.
Grand Cereals Limited (GCL) Graduate Trainee Programme 2024
International Liaison Assistant at the British High Commission
IT Associate at the United Nations High Commissioner for Refugees
Project Supervisor at Greenfield Consulting Limited
Procurement Officer at EPCM Engineers Limited
Chemical Engineer at EPCM Engineers Limited
Legal Secretary / Front Desk Administrator at UnoCasa Limited
Mechanical Engineer at EPCM Engineers Limited
Logistics Site Manager II at the International Committee of the Red Cross