Pie Charts Questions & Answers

Share on
1.

The circle-graph given here shows the spendings of a country on various sports during a particular year. Study the graph carefully and answer the questions given below it.

If the total amount spent on sports during the year was Rs. 2 crores (i.e 20 million), the amount spent on Cricket and Hockey together was:

A.

Rs. 800,000

B.

Rs. 8,000,000

C.

Rs. 12,000,000

D.

Rs. 16,000,000

Correct answer is B

Amount spent on Cricket and Hockey together = Rs. [ (81 + 63)/360 x 2 ] crores

= Rs. 0.8 crores

= Rs. 8,000,000

2.

The circle-graph given here shows the spendings of a country on various sports during a particular year. Study the graph carefully and answer the questions given below it.

How much percent less is spent on Football than that on Cricket?

A.

22 2⁄9%

B.

27%

C.

33 1⁄3%

D.

37 1⁄7%

Correct answer is C

Let the total spendings on sports be Rs. x

Then, Amount spent on Cricket = Rs. ( 81/360 x x ) = Rs. 9x/40

Amount spent on Football = Rs ( 54/360 x x ) = Rs. 3x/20

Difference = Rs. ( 9x/40 - 3x/20 ) = Rs 3x/40

Therefore Required percentage = Rs. [ ((3x/40)/(9x/40)) x 100 ] % = 33 1⁄3 %

3.

The circle-graph given here shows the spendings of a country on various sports during a particular year. Study the graph carefully and answer the questions given below it.

If the total amount spent on sports during the year is Rs. 18,000,000, the amount spent on Basketball exceeds that of Tennis by:

A.

Rs. 250,000

B.

Rs. 360,000

C.

Rs. 375,000

D.

Rs. 410,000

Correct answer is A

Amount spent on Basketball exceeds that on Tennis by:

Rs. ( (50 - 45)/360 x 18,000,000 ) = Rs. 250,000

4.

The circle-graph given here shows the spendings of a country on various sports during a particular year. Study the graph carefully and answer the questions given below it.

How much percent more is spent on Hockey than that on Golf?

A.

27%

B.

35%

C.

37.5%

D.

75%

Correct answer is D

Let the total spendings on sports be Rs. x. Then,

Amount spent on Golf = Rs. ( (36/360) x x ) = Rs. x/10

Amount spent on Hockey = Rs ( (63/360) x x ) = Rs. 7x/40

Difference = Rs. ( 7x/40 - x/10 ) = Rs 3x/40

Therefore Required percentage = Rs. [ (3x/40)/(x/10) x 100 ] % = 75%.

5.

The circle-graph given here shows the spendings of a country on various sports during a particular year. Study the graph carefully and answer the questions given below it.

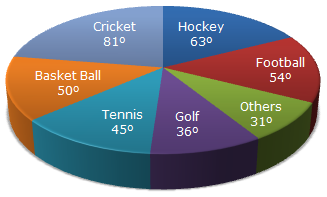
What percent of total spending is spent on Tennis?

A.

12 1⁄2%

B.

22 1⁄2%

C.

25%

D.

45%

Correct answer is A

Percentage of money spend on Tennis = ( (45/360) x 100 ) % = 12 1⁄2%

6.

The following pie-charts show the distribution of students of graduate and post-graduate levels in seven different institutes in a town.

Distribution of students at graduate and post-graduate levels in seven institutes:

Total number of students studying at post-graduate level from institutes N and P is

A.

5601

B.

5944

C.

6669

D.

8372

Correct answer is C

Required number = (15% of 24700) + (12% of 24700)

= 3705 + 2964

= 6669

7.

The following pie-charts show the distribution of students of graduate and post-graduate levels in seven different institutes in a town.

Distribution of students at graduate and post-graduate levels in seven institutes:

What is the ratio between the number of students studying at post-graduate level from institutes S and the number of students studying at graduate level from institute Q?

A.

13 : 19

B.

21 : 13

C.

13 : 8

D.

19 : 13

Correct answer is D

Required ratio = (21% of 24700)/(13% of 27300) = (21 x 24700)/(13 x 27300) = 19/13

8.

The following pie-charts show the distribution of students of graduate and post-graduate levels in seven different institutes in a town.

Distribution of students at graduate and post-graduate levels in seven institutes:

How many students of institutes of M and S are studying at graduate level?

A.

7516

B.

8463

C.

9127

D.

9404

Correct answer is B

Students of institute M at graduate level= 17% of 27300 = 4641.

Students of institute S at graduate level = 14% of 27300 = 3822.

Therefore Total number of students at graduate in institutes M and S  = (4641 + 3822) 

= 8463

9.

The following pie-charts show the distribution of students of graduate and post-graduate levels in seven different institutes in a town.

Distribution of students at graduate and post-graduate levels in seven institutes:

What is the ratio between the number of students studying at post-graduate and graduate levels respectively from institute S?

A.

14 : 19

B.

19 : 21

C.

17 : 21

D.

19 : 14

Correct answer is D

Required ratio = (21% of 24700)/(14% of 27300) = (21 x 24700)/14 x 27300 = 19/14

10.

The following pie-charts show the distribution of students of graduate and post-graduate levels in seven different institutes in a town.

Distribution of students at graduate and post-graduate levels in seven institutes:

What is the total number of graduate and post-graduate level students in institute R?

A.

8320

B.

7916

C.

9116

D.

8099

Correct answer is D

Required number = (17% of 27300) + (14% of 24700)

= 4641 + 3458

= 8099.