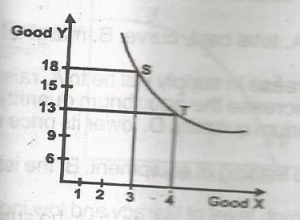
In the diagram above, the marginal rate of substitution o...

In the diagram above, the marginal rate of substitution of X for Y, for a movement from S to T is
13.3
1.5
18.4
5.1
Correct answer is D
To produce 18 units of Y, at point S, 3 units of X was produced at the same point S. A movement along the production chart from point S to T, the firm gave up 5 units of Y to produce 4 units of X. This means that the firm gave up 5 units of product Y to produce 1 additional unit of X.
The ratio of substitution is 5:1
Similar Questions
The ownership of a public limited liability company is made up of ...
The necessary condition for a firm to be in equilibrium is that marginal revenue is ...
The study of broad economic aggregates is ...
Derived demand is normally used with reference to ...
The financial institution known as a building society is ...
The theory of ............... was propounded by .................. ...
When total utility is at maximum, then marginal utility is ...