From the graph above, R represents
...
From the graph above, R represents
Marginal cost
Total cost
Variable cost
Fixed cost
Correct answer is B
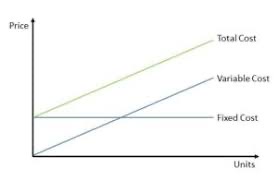
R represents Total cost which is the total economic cost of production and is made up of variable cost and fixed cost.
The diagram below would help you know how to identify the various types of cost,
Similar Questions
One of the functions of commercial banks is ...
From the graph above the consumer will attain equilibrium at point______________ ...
Industries contribute to national economic development because they ...
In Nigeria, the government can reduce the cost of accommodation by fixing the rent ...
A long-term capital outflow is recorded in the balance of payment as a ...
If monopoly is attempting to maximize profit, which of the following should it attempt to do ...
The public sector in a mixed economy is not always because of ...
The balance of visible trade is the difference between the values of ...