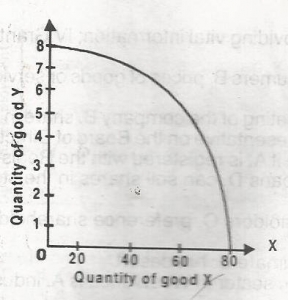
The above diagram showing the maximum possible combinatio...

The above diagram showing the maximum possible combination of commodities X and Y produced in Nigeria is called the
Production indicator
Maximum production curve
Production possibility curve
Total output curve
Correct answer is C
No explanation has been provided for this answer.
Similar Questions
Public expenditure on on education and health is known as expenditure on ...
The investment expenditure of an economy changes by N2 million and MPC is 0.75 The multiplier is ...
In a limited liability company, the greatest risk is borne by? ...
The gains from international trade are shared on the basis of the ...
In a free market economy, the rationing of scarce goods is done principally by ...
An imperfect competitor is in equilibrium when ...
Which of the following is compatible with a firm in a purely competitive market? ...