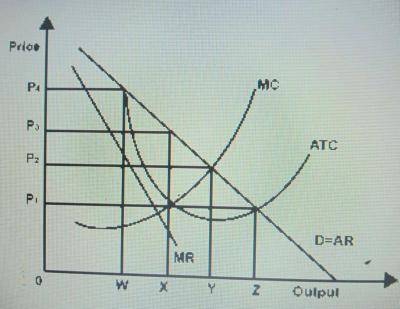
The diagram above represent
...
The diagram above represent
A.
Perfect competition
B.
Monopoly
C.
Demand curve
D.
Competitive market
Correct answer is B
The diagram above represent a monopolist diagram.
Similar Questions
Inflation caused by increase in demand can be curbed by ...
In a price-taking firm, the portion UT above is the firm's ...
It is impossible to satisfy all human wants because ...
Above the equilibrium point, a further rise in price tends to ...
From an economic point of view, an activity does not have a cost when ...
Which would you NOT consider an advantage of one-man business? ...
The return of investment that is just sufficient to satisfy the owner of a business is called ...
Which of the following is excluded when making national income? ...