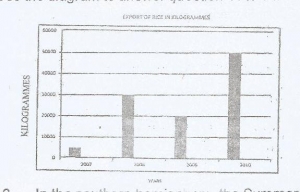
The diagram above represents the export of rice i...

The diagram above represents the export of rice in Kilogrammes from Country X between 2007 and 2010.
The total production of rice in Kilogrammes by Country X from 2007 - 2010 was?
60,000
105,000
200,000
260,000
Correct answer is B
No explanation has been provided for this answer.
Similar Questions
A country which experiences earthquakes frequently is? ...
A distinctly bedded and usually well-jointed sedimentary rock is? ...
The total population of a country can be obtained from its? ...
The wind system that brings the harmattan to Africa is referred to as ...
_______ is defined as the total surrounding or medium of any organism in a given area ...
If the total population of the city is 500,000. What is the population of ward4? ...
Which of the following is not a proof of the spherical shape of the Earth? ...