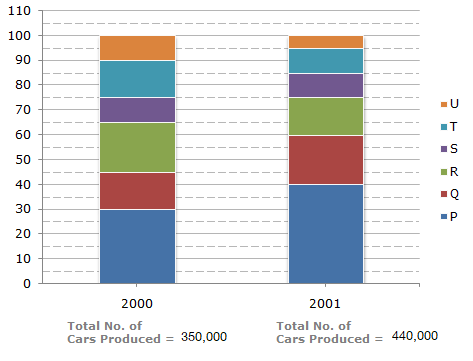
The bar graph given below shows the percentage distribution of the total production of a car manufacturing company into various models over two years.
Percentage of Six different types of Cars manufactured by a Company over Two Years

For which model is the percentage rise/fall in production from 2000 to 2001 the minimum?
Q
R
S
T
Correct answer is B
The percentage change (rise/fall) in production from 2000 to 2001 for various models is:
For P = [ (176000 - 105000)/105000 x 100 ] % = 67.62%, rise.
For Q = [ (88000 - 52500)/52500 x 100 ] % = 67.62%, rise.
For R = [ (70000 - 66000)/70000 x 100 ] % = 5.71%, fall.
For S = [ (44000 - 35000)/35000 x 100 ] % = 25.71%, rise.
For T = [ (52500 - 44000)/52500 x 100 ] % = 16.19%, fall.
For U = [ (35000 - 22000)/35000 x 100 ] % = 37.14%, fall.
Therefore Minimum percentage rise/fall in production is the case of model R.
The bar graph given below shows the percentage distribution of the total production of a car manufacturing company into various models over two years.
Percentage of Six different types of Cars manufactured by a Company over Two Years

7,650
9,350
11,850
12,250
Correct answer is C
Number of S type cars which remained unsold in 2000 = 15% of 35,000
and number of S type cars which remained unsold in 2001 = 15% of 44,000.
Therefore Total number of S type cars which remained unsold
= 15% of (35,000 + 44,000)
= 15% of 79,000
= 11,850.
The bar graph given below shows the percentage distribution of the total production of a car manufacturing company into various models over two years.
Percentage of Six different types of Cars manufactured by a Company over Two Years

140,000
132,000
117,000
105,000
Correct answer is B
If the percentage production of P type cars in 2001
= Percentage production of P type cars in 2000
= 30%.
then, number of P type cars produced in 2001
= 30% of 440,000
= 132,000.
The bar graph given below shows the percentage distribution of the total production of a car manufacturing company into various models over two years.
Percentage of Six different types of Cars manufactured by a Company over Two Years

Total number of cars of models P, Q and T manufactured in 2000 is?
245,000
227,500
210,000
192,500
Correct answer is C
Analysis of the graph:
We shall first determine the number of cars of each model produced by the Company during the two years:
In 2000 : Total number of cars produced = 3,50,000.
P = (30 - 0)% of 350,000 = 30% of 350,000 = 105,000.
Q = (45 - 30)% of 350,000 = 15% of 350,000 = 52,500.
R = (65 - 45)% of 350,000 = 20% of 350,000 = 70,000.
S = (75 - 65)% of 350,000 = 10% of 350,000 = 35,000.
T = (90 - 75)% of 350,000 = 15% of 350,000 = 52,500.
U = (100 - 90)% of 350,000 = 10% of 350,000 = 35,000.
In 2001 : Total number of cars produced = 4,40,000.
P = (40 - 0)% of 440,000 = 40% of 440,000 = 176,000.
Q = (60 - 40)% of 440,000 = 20% of 440,000 = 88,000.
R = (75 - 60)% of 440,000 = 15% of 440,000 = 66,000.
S = (85 - 75)% of 440,000 = 10% of 440,000 = 44,000.
T = (95 - 85)% of 440,000 = 10% of 440,000 = 44,000.
U = (100 - 95)% of 440,000 = 5% of 440,000 = 22,000.
Total number of cars of models P, Q and T manufacture in 2000
= (105000 + 52500 + 52500)
= 210,000.
The bar graph given below shows the percentage distribution of the total production of a car manufacturing company into various models over two years.
Percentage of Six different types of Cars manufactured by a Company over Two Years
What was the difference in the number of Q type cars produced in 2000 and that produced in 2001?
35,500
27,000
22,500
17,500
Correct answer is A
Total number of Q type cars produced in 2001
=(60 - 40)% of 4,40,000 = 88,000.
Total number of Q type cars produced in 2000
=(45 - 30)% of 3,50,000 = 52,500.
Therefore Required difference = (88000 - 52500) = 35,500.
Aptitude Tests
Latest Jobs
Customer Care Executive in a Telecommunications Company
Treasury & Risk Manager at AAA Finance and Investment Company Limited
HR and Administration Officer at CBM Global Disability Inclusion
Storekeeper at Transgeneration Enterprises Limited
Volunteer HR Manager at Sim Impacting Lives Foundation
Partnerships and Network Lead at Adewunmi Desalu Parkinson's Foundation
Account Officer at Bons Industries Limited
Manager - Sales and Trade Development, Lagos Boundary at MTN Nigeria
Permit to Work Coordinator at WTS Energy
Business Development Executive at ARCO Worldwide Services Limited