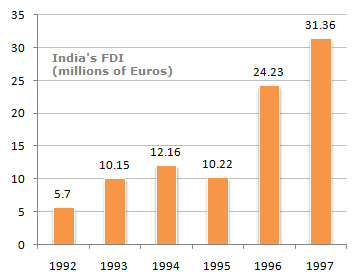
The following bar chart shows the trends of foreign direct investments(FDI) into India from all over the world.
Trends of FDI in India
What was India's total FDI for the period shown in the figure ?
93.82
93.22
93.19
None of these
Correct answer is A
Total FDI investment in the figure shown is = 5.7 + 10.15 + 12.16 + 10.22 + 24.23 + 31.36 = 93.82 billion.
The following bar chart shows the trends of foreign direct investments(FDI) into India from all over the world.
Trends of FDI in India

Which year exhibited the highest growth in FDI in India over the period shown ?
1993
1994
1995
1996
Correct answer is D
It can be seen that the FDI in 1996 more than doubles over that of 1995. No other year is close to that rate of growth.

The following bar chart shows the trends of foreign direct investments(FDI) into India from all over the world.
Trends of FDI in India

What was absolute difference in the FDI to India in between 1996 and 1997 ?
7.29
7.13
8.13
None of these
Correct answer is B
The difference in investments over 1996-1997 was
31.36 - 24.23 = € 7.13 millions.
Aptitude Tests
Latest Jobs
Graduate Trainee at Coleman Technical Industries Limited
Secretary in a Leading Telecommunication Company
Finance and Accounts Manager at Best Pest Exterminators Limited
Social Media Manager at Techmosaic Alliance Limited
Food Safety and Quality Control Officer at RiverBrand Energy Limited
Humanitarian Affairs Officer / Head of Field Coordination at the United Nations (UN)
Mid-Level Accountant at Esthod Global Services Nigeria Limited
Operations Manager - Completions at Weatherford Nigeria Limited
Senior Accountant at RiverBrand Energy Limited
Marketing Lead, Industrial Gas at Cometstar Manufacturing Company Limited