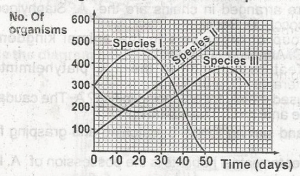
In the diagram, the population size of species II on the 20th day is
100
200
300
400
Correct answer is B
No explanation has been provided for this answer.

the population of species ii is growing at a slow rate
the population of species iii has reached its carrying capscity
the population of species I has become extinct
the population of species I is always
Correct answer is C
No explanation has been provided for this answer.
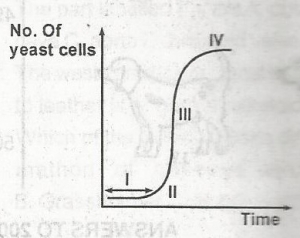
In the diagram, the part labelled IV indicate that the yeast population has
reached its maximum size
reached senescence
stopped metabolizing food
started dying
Correct answer is A
No explanation has been provided for this answer.
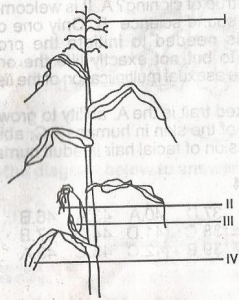
In the diagram, the illustration is a typical example of a plant pollinated by
wind
man
insects
birds
Correct answer is A
No explanation has been provided for this answer.
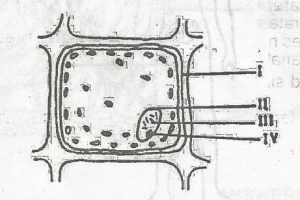
In the diagram, the part labelled I is the
nuclear membrane
cell wall
endoplasmic recticulum
plasmellema
Correct answer is B
No explanation has been provided for this answer.
JAMB Subjects
Aptitude Tests