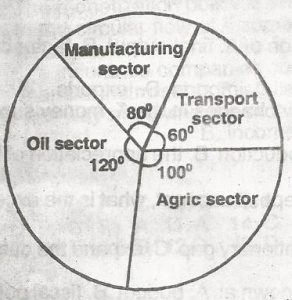
The percentage contribution of the transport sector is:
600.0
166.7
60.0
16.7
Correct answer is D
Percentage contribution of the transport sector = 6036060360 x 100
16.66 approximately 16.7
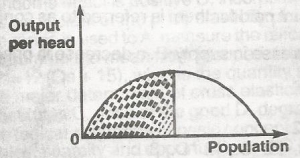
From the shaded area of the diagram above, an appropriate population policy will be to
Encourage early marriages
discourage Immigration
Discourage polygamy
Encourage the use of contraceptives
Correct answer is A
No explanation has been provided for this answer.
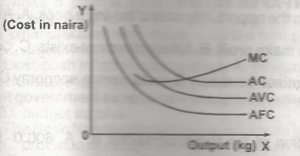
From the graph above , point M shows that MC
Cuts AC at its minimum point
And AC rises simultaneously
Cuts AC at its maximum point
Is falling
Correct answer is C
No explanation has been provided for this answer.
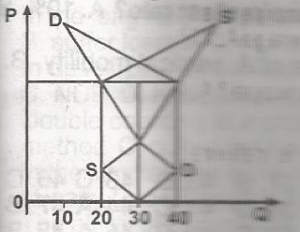
In the diagram above, there is an excess
Demand for 30 units
Supply of 40 units
Demand for 20 units
Supply of 20 units
Correct answer is B
Excess demand occured when 40 units were supplied. This is because, at this point, the demand was the same as at when 20 units was supplied. Therefore supplying 40 units when the maximum demand by the market is 20, would lead to excess supply.
N8.00
N5.00
N11.00
N6.50
Correct answer is D
No explanation has been provided for this answer.
JAMB Subjects
Aptitude Tests