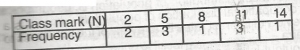
The table shows the wage distribution of workers. Calculate the mean wage
N7.40
N4.00
N10.00
N14.80
Correct answer is A
No explanation has been provided for this answer.
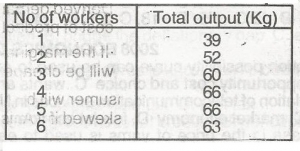
What is the marginal productivity when the number of workers is increased from 2 to 3?
8kg
20kg
60kg
180kg
Correct answer is A
No explanation has been provided for this answer.

The maximum number of workers that should be hired is
2
3
4
5
Correct answer is C
No explanation has been provided for this answer.
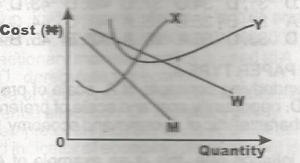
Marginal cost
Average cost
Average revenue
Marginal revenue
Correct answer is C
No explanation has been provided for this answer.
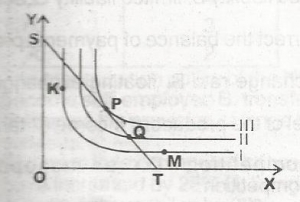
A point P, the marginal rate of substitution is
Less than one
Greater than one
Zero
Unity
Correct answer is C
No explanation has been provided for this answer.
JAMB Subjects
Aptitude Tests