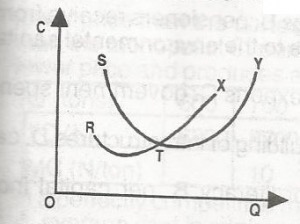
TX
RT
ST
TY
Correct answer is A
No explanation has been provided for this answer.
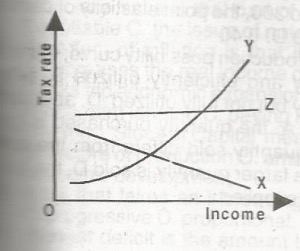
The relationship between tax rate and income which is relevant to a proportional tax is disputed by
Curves Z and Y
Curve X
Curve Z
Curve Y
Correct answer is C
No explanation has been provided for this answer.
A rise in income will, ceteris paribus, bring about
A movement along the demand curve
A leftward shift of the demand curve
A rightward shift of the demand curve
No effect on the demand curve
Correct answer is C
All things being equal, a rise in income will lead to a rightward shift in demand. A rightward shift in the demand curve could also be as a result of higher price of a substitute good, lower price of a complement good, etc.
Consumers' income
Demand
Consumers' tastes
Quantity damanded
Correct answer is D
A change in quantity demanded refers to a change in the specific quantity of a product that buyers are willing and able to buy usually caused by a change in the price. From the question above, a rise in prise led to a corresponding change in the quantity demanded from 250 to 200 units.
The sign of the slope of a graph in economic analysis is important because it
Shows whether a good is normal or inferior
Shows the relationship between variables
Reveals the magnitude of the change between variables
Helps to determine the unit of measurement of variables
Correct answer is C
The concept of slope is important in economics because it is used to measure the rate at which changes are taking place. It shows how things change and about how one item changes in response to a change in another item.
JAMB Subjects
Aptitude Tests