The most suitable statistical diagram to show spatial distribution of production is the
dot map
pie chart
divided circle
line graph
Correct answer is A
No explanation has been provided for this answer.
A feature commonly found in the youthful stage of a river is
Levee
Meander
Ox-bow lake
Interlocking spurs
Correct answer is D
No explanation has been provided for this answer.

What is the approximate length of the railway line on the map above?
29km
37km
40km
45km
Correct answer is B
No explanation has been provided for this answer.
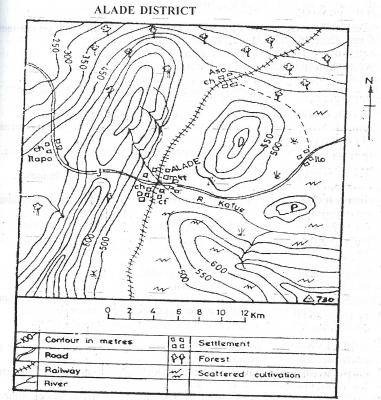
Which area on the map given above can the trigonometrical station be found?
North-east
South-east
North-west
South-west
Correct answer is B
No explanation has been provided for this answer.

On the map above, the highest contour is
800m
750m
730m
700m
Correct answer is B
No explanation has been provided for this answer.
JAMB Subjects
Aptitude Tests