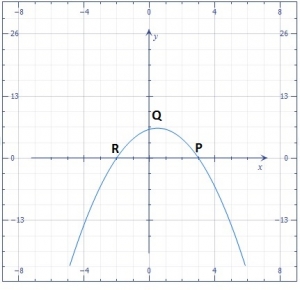
The diagram is the graph of \(y = 6 + x - x^2\). The grap...

The diagram is the graph of \(y = 6 + x - x^2\). The graph intercepts the x- axis at P and R and the y- axis at Q.
When \(y = 3\frac{1}{3}\), what is the positive value of x?
\( 2\frac{1}{2}\)
\( 2\frac{1}{5}\)
\( 1\frac{1}{5}\)
0
Correct answer is B
No explanation has been provided for this answer.
Similar Questions
Find the total surface area of a cylinder of base radius 5cm and length 7cm ( π = 3.14) ...
If 9x2 + 6xy + 4y2 is a factor of 27x3 - 8y3, find the other factor. ...
m:n = \(2\frac{1}{3} : 1\frac{1}{5}\) and n : q = \(1\frac{1}{2} : 1\frac{1}{3}\), find q : m....
Given that logp = 2 logx + 3logq, which of the following expresses p in terms of x and q? ...
In the diagram, find PQ if the area of triangle PQR is 35cm\(^2\)...
The table above gives the scores of a group of students in an English Language test If a student ...
In the diagram above, |XR| = |RY| = |YZ| and ∠XRY = ∠YRZ = 62o, Calculate ∠XYZ ...