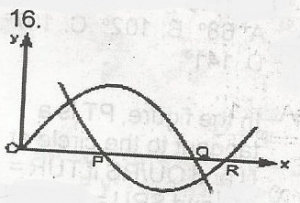
The figure represents the graphs of y = x(2 - x) and y = ...

The figure represents the graphs of y = x(2 - x) and y = (x - 1)(x - 3). What are the x-coordinates of P, Q and F respectively?
1, 3, 2
0, 0, 0
0, 2, 3
1, 2, 3
Correct answer is D
The two equations are y = x(2 - x) and y = (x - 1)(x - 3)
The root of these equations are points where the graph of the equations cuts the x axis; but at these points = 0
put y = 0; 0 = x(2 - x)
0 = (x - 1)(x - 3)
x = 0 or x = 2; x = 1 or x = 3
The values of x at P, Q, R are increasing towards the positive direction of x-axis
at P, x = 1 at Q, x = 2 at R, x = 3
P, Q, R are respectively (1, 2, 3)
Similar Questions
If x + \(\frac{1}{x}\) = 4, find x2 + \(\frac{1}{x^2}\)...
A fair die is tossed once, what is the probability of obtaining neither 5 or 2 ...
Evaluate (0.13)\(^3\)correct to three significant figures ...
A box contains 2 white and 3 blue identical balls. If two balls are picked at random from the b...
Find the mean deviation of the set of numbers 4, 5, 9...
Which of the following is not a sufficient condition for two triangles to be congruent? ...