The bar chart represents the distribution of marks scored...

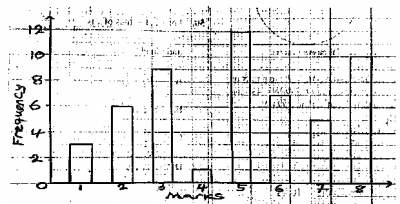
The bar chart represents the distribution of marks scored by students in an economics examination. Use the bar chart to answer questions 30 to 32
If the failed mark was 4, what is the probability that a student selected at random passed?
0.36
0.74
0.52
0.64
Correct answer is D
Total number of students = total frequency = 3 + 6 + 9 + 1 + 12 + 7 + 5 + 10 = 53
Since the failed mark was 4,
Total number of students that passed = 12 + 7 + 5 + 10 = 34
Pr( passed) = \(\frac{34}{53}\) = 0. 64
Similar Questions
What is the range of their age?...
Calculate the standard deviation of the following marks; 2, 3, 6, 2, 5, 0, 4, 2 ...
Calculate the value of y in the diagram...
Find the \(n^{th}\) term of the sequence 2 x 3, 4 x 6, 8 x 9, 16 x 12......
In the diagram, PTS is a tangent to the circle TQR at T. Calculate < RTS...