The diagram above represents the stress-strain graph for ...
The diagram above represents the stress-strain graph for a typical metal rod. What does the X represent?
Breaking point
Yield point
Elastic limit
Proportional limit
Correct answer is A
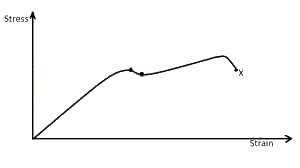
In the stress - strain graph shown above, X represents the breaking point of the wire
The figure above shows three capacitors, 2μF, 3μF and 6μF connected in series. If the p.d a...
Which of the following statement about viscosity is not true? it ...
A radioactive element has a decay constant of 0.077s-1, calculate its half life...
The thermopile is a device for detecting ...
The following statements about a loudspeaker are correct except? ...
If the temperature of a resistance wire is gradually increased, its resistance will ...
Which of the following is a type of wave that is both mechanical and longitudinal? ...
A circuit has a resistance of 200Ω. The resistance of the circuit can be reduced to 120Ω when ...