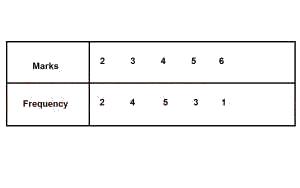
The data below shows the frequency distribution of marks ...

The data below shows the frequency distribution of marks scored by a group of students in a class test.
Find the mean mark.
A.
1
B.
1.3
C.
2
D.
3
E.
3.8
Correct answer is E
No explanation has been provided for this answer.
Similar Questions
The value of x + x ( xx) when x = 2 is ...
What is the mean of the data t, 2t-1, t-2, 2t -1, 4t and 2t+2? ...
The distance between two towns is 50km. It is represented on a map by 5cm. Find the scale used ...
Factorize abx2 + 8y - 4bx - 2axy...
If 2\(_9\) x (Y3)\(_9\) = 3\(_5\) x (Y3)\(_5\), find the value of Y. ...