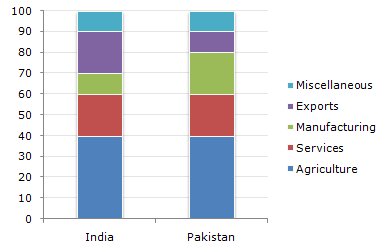
The following bar chart shows the composition of the GDP of two countries (India and Pakistan).
Composition of GDP of Two Countries

Which country accounts for higher earning out of Services and Miscellaneous together ?
India
Pakistan
Both spend equal amounts
Cannot be determined
Correct answer is D
Although the percentage on Services and Miscellaneous put together is equal for both the countries, we cannot comment on this since we have no data about the respective GDP's.

The following bar chart shows the composition of the GDP of two countries (India and Pakistan).
Composition of GDP of Two Countries

What fraction of India's GDP is accounted for by Services ?
(6/33)th
(1/5)th
(2/3)rd
None of these
Correct answer is B
Service accounts for 20%, i.e., (1/5)th of the GDP of India.
The following bar chart shows the composition of the GDP of two countries (India and Pakistan).
Composition of GDP of Two Countries

If the total GDP of Pakistan is Rs. 10,000 crore, then a GDP accounted for by Manufacturing is ?
Rs.200 crore
Rs.600 crore
Rs.2,000 crore
Rs.6,000 crore
Correct answer is C
20% of 10000 = 2000
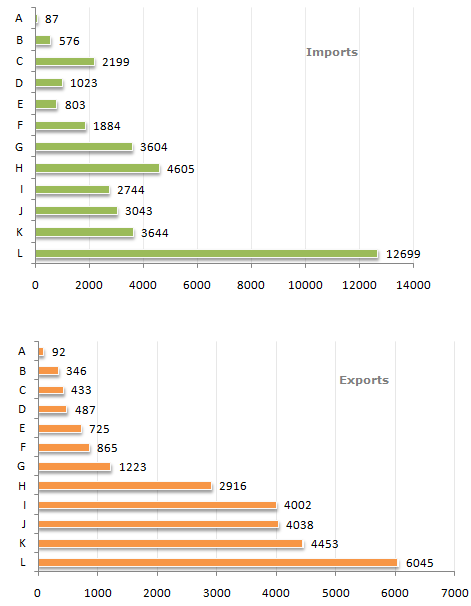
Study the following bar charts and answer the questions.
Foreign Trade (Imports and Exports) by countries for the year (1993 - 1994)
The ratio of Exports to Imports was highest for which country ?
A
I
J
K
Correct answer is B
I has a ratio of 4002/2744 = 1.45, which is the highest.
Study the following bar charts and answer the questions.
Foreign Trade (Imports and Exports) by countries for the year (1993 - 1994)

The highest trade deficit was shown by which country ?
C
G
H
L
Correct answer is D
Visually its clear that L has the highest trade deficit.
Study the following bar charts and answer the questions.
Foreign Trade (Imports and Exports) by countries for the year (1993 - 1994)

The total trade deficit/surplus for all the countries put together was ?
11286 surplus
11286 deficit
10286 deficit
None of these
Correct answer is B
Sum of exports - Sum of imports = deficit(11286).
Study the following bar charts and answer the questions.
Foreign Trade (Imports and Exports) by countries for the year (1993 - 1994)

How many countries exhibited a trade surplus ?
5
4
3
6
Correct answer is B
Out of a total of 12 countries, 8 showed a deficit while 4 showed a surplus.
Study the following bar charts and answer the questions.
Foreign Trade (Imports and Exports) by countries for the year (1993 - 1994)

The ratio of the maximum exports to the minimum imports was closest to ?
64
69
74
79
Correct answer is B
The value of maximum exports = 6045.
The value of minimum imports = 87.
Therefore, the required ratio (6045/87) = 69.48 = 69 (approximately).
Aptitude Tests
Latest Jobs
Video Editor at Abakon Integrated Services Limited
Health, Safety, and Environment (HSE) Officer at Whassan Nigeria Limited
Record Management Officer at Medecins Sans Frontieres (MSF)
Packaging Machine Operator - Golden Pasta at Flour Mills of Nigeria Plc
Factory Accountant at Dufil Prima Foods Plc
Emergency Medical Technician - Paramedic Trainer at International NGO Safety Organisation (INSO)
CNC Operator at African Steel Mills (Nigeria) Limited
Sales Manager at SalesPlat Technologies