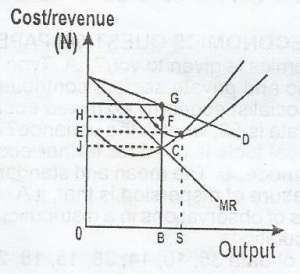
The optimum level of output of the firm is
BC
OB
OS
BS
Correct answer is B
No explanation has been provided for this answer.
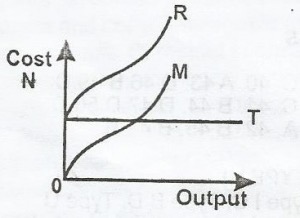
From the graph above, R represents
Marginal cost
Total cost
Variable cost
Fixed cost
Correct answer is B
R represents Total cost which is the total economic cost of production and is made up of variable cost and fixed cost.
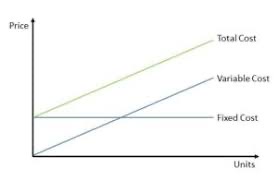
The diagram below would help you know how to identify the various types of cost,
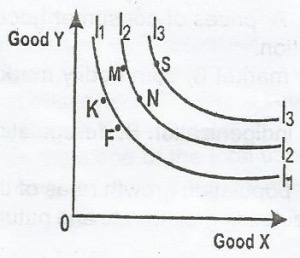
From the indifference curve above, consumer will prefer combination
F
S
M
K
Correct answer is B
From the above diagram, consumers would mostly likely get the highest level of utility at point S. Because at point S, 3 of Y = 3 of X
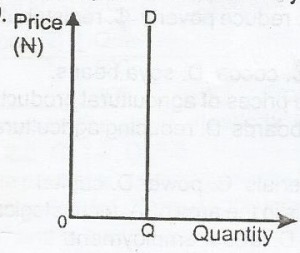
From the graph above, the price elasticity of demand is
Unitarily elastic
Perfectly elastic
Perfectly inelastic
Fairly inelastic
Correct answer is C
Price elasticity of demand is the degree to which a change in price would affect the quantity demanded or supplied of a product. From the diagram above, price elasticity of demand is perfectly inelastic (that is, the quantity demanded does not respond to price.) When price was zero, the quantity demanded remained unchanged/ the same.
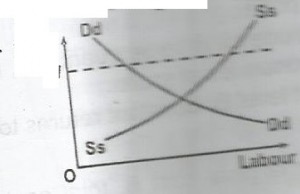
From this diagram, the minimum wage OW will lead to
Full employment of resources
Unemployment
Inflation
Full employment of factors of production
Correct answer is D
The point OW shows that labour is highly utilized and the wage rate is competitive. This means the factors of production (labour and wage ) have been highly utilized.
JAMB Subjects
Aptitude Tests