
V
W
X
Z
Correct answer is B
No explanation has been provided for this answer.
Use the production possibility curve of a country represented in the diagram above to this questions.
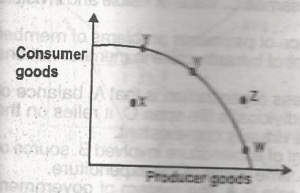
An improvement in technology will enable the country to produce at
V
W
X
Z
Correct answer is D
No explanation has been provided for this answer.
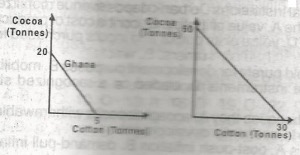
In the diagrams, the opportunity cost of a unit of cotton in terms of cocoa is
4 for Ghana; 2 for Nigeria
20 for Ghana; 60 for Nigeria
1/4 for Ghana; 1/2 for Nigeria
5 for Ghana; 30 for Nigeria
Correct answer is C
No explanation has been provided for this answer.
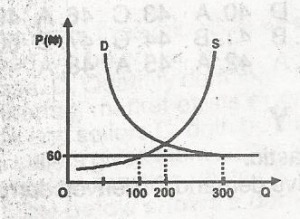
In the diagram above, what is the excess demand at the price of N60?
200
300
600
100
Correct answer is B
No explanation has been provided for this answer.
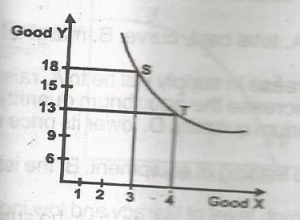
In the diagram above, the marginal rate of substitution of X for Y, for a movement from S to T is
13.3
1.5
18.4
5.1
Correct answer is D
To produce 18 units of Y, at point S, 3 units of X was produced at the same point S. A movement along the production chart from point S to T, the firm gave up 5 units of Y to produce 4 units of X. This means that the firm gave up 5 units of product Y to produce 1 additional unit of X.
The ratio of substitution is 5:1
JAMB Subjects
Aptitude Tests