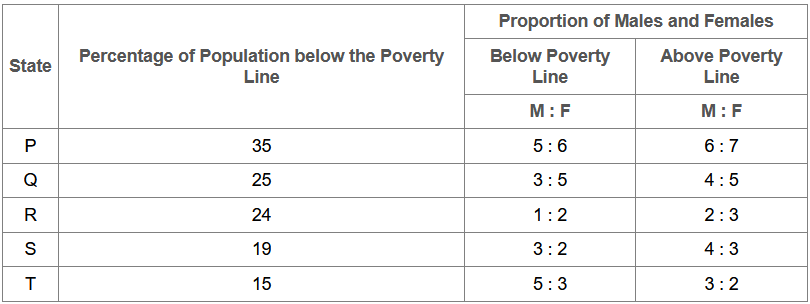
The following table gives the percentage distribution of population of five states, P, Q, R, S and T on the basis of poverty line and also on the basis of sex.
1:3
2:5
3:7
4:9
Correct answer is B
For State Q:
Male population below poverty line = 2.4 million.
Let the female population below poverty line be x million.
Then, 3 : 5 = 2.4 : x => x = (5 x 2.4)/3 = 4
Therefore Total population below poverty line = (2.4 + 4) = 6.4 million.
If Nq be the total population of State Q, then,
25% of Nq = 6.4 million => Nq = ( (6.4 x 100)/25 ) million = 25.6 million.
For State T:
Male population below poverty line = 6 million.
Let the female population below poverty line be y million.
Then, 5 : 3 = 6 : y => y = (3 x 6)/5 = 3.6
Therefore Total population below poverty line = (6 + 3.6) = 9.6 million.
If Nt be the total population of State T, then,
15% of Nt = 9.6 million => Nt = ( (9.6 x 100)/15 ) million = 64 million.
Thus, Required ratio = Nq/Nt = 25.6/64 = 0.4 = 2.5
The following table gives the percentage distribution of population of five states, P, Q, R, S and T on the basis of poverty line and also on the basis of sex.

2.1 million
2.3 million
2.7 million
3.3 million
Correct answer is D
Female population below poverty line for State P = 2.1 million
Let the male population below poverty line for State P be x million.
Then, 5 : 6 = x : 21 => x = (2.1 x 5)/6 = 1.75
Therefore Population below poverty line for State P = (2.1 + 1.75) million = 3.85 million.
Let the population above poverty line for State P be y million.
Since, 35% of the total population of State P is below poverty line, therefore, 65% of the total population of State P is above poverty line i.e., the ratio of population below poverty line to that above poverty line for State P is 35 : 65.
Therefore 35 : 65 = 3.85 : y => y = (65 x 3.85)/35 = 7.15
Therefore Population above poverty line for State P = 7.15 million and so, male population above poverty line for State P
= ( 6/13 x 7.15 ) million
= 3.3 million
The following table gives the percentage distribution of population of five states, P, Q, R, S and T on the basis of poverty line and also on the basis of sex.

3 million
2.43 million
1.33 million
5.7 million
Correct answer is B
Total population of State S = 7 million.
Therefore Population above poverty line
= [(100 - 19)% of 7] million
= (81% of 7) million
= 5.67 million.
And so, the number of females above poverty line in State S
= ( 3/7 x 5.67 ) million
= 2.43 million.
The following table gives the percentage distribution of population of five states, P, Q, R, S and T on the basis of poverty line and also on the basis of sex.

4.5 million
4.85 million
5.35 million
6.25 million
Correct answer is D
Let the total population of State R be x million.
Then, population of State R above poverty line
= [(100 - 24)% of x] million
= ( 76/100 x x ) million
And so, male population of State R above poverty line
= [ 2/5 x ( 76/100 x x ) ] million
But, it is given that male population of State R above poverty line= 1.9 million.
Therefore 2/5 x ( 76/100 x x ) = 1.9 => x = (5 x 100 x 1.9)/76 x 2 = 6.25
Therefore Total population of State R = 6.25 million.
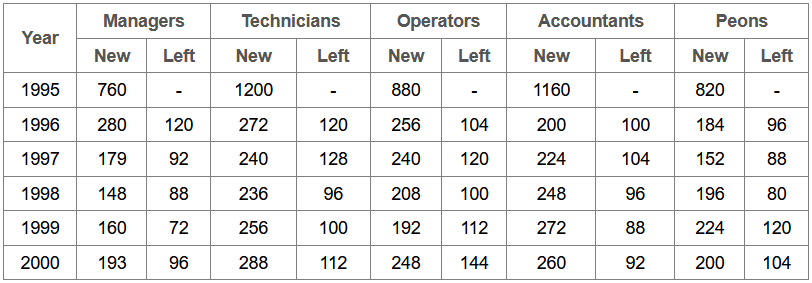
The following table shows the number of new employees added to different categories of employees in a company and also the number of employees from these categories who left the company every year since the foundation of the Company in 1995.
19%
21%
27%
29%
Correct answer is D
Total number of Operators who left the Company during 1995 - 2000
= (104 + 120 + 100 + 112 + 144)
= 580.
Total number of Operators who joined the Company during 1995 - 2000
= (880 + 256 + 240 + 208 + 192 + 248)
= 2024.
Therefore Required Percentage
= ( 580/2024 x 100 ) %
= 28.66%
≈ 29%.
Aptitude Tests