Line graph
Pie chart
Bar graph
Flow chart
Correct answer is C
No explanation has been provided for this answer.

Which of the following towns may not be visible from the feature marked H?
Sasi
Doba
Duba
Oki
Correct answer is D
No explanation has been provided for this answer.
because a large percentage of the population lives in Sasi
to provide a means of transporting fish from Sasi to IREWA
to carry the farmers from Sasi to IREWA
to evacuate farm products from the plantation to the market at IREWA
Correct answer is D
No explanation has been provided for this answer.

Which of the following best explains the growth of IREWA?
Nodal town
Centre of plantation agriculture
Good climate
Industrial town
Correct answer is A
No explanation has been provided for this answer.
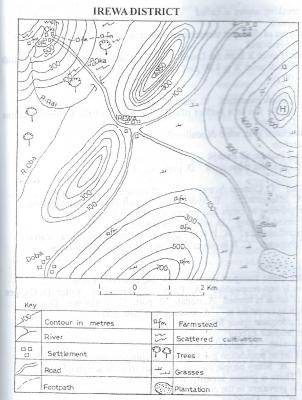
The most likely occupation of the people of Oki is
fishing
mining
farming
lumbering
Correct answer is C
No explanation has been provided for this answer.
WAEC Subjects
Aptitude Tests