Data Interpretation questions and answers

Data Interpretation Questions and Answers

Data Interpretation questions test one's ability in analysing data, inspecting the elements in data and interpreting them to extract maximum information from the given set of data or information. The data is usually given in the form of charts, tables and graphs.

Practise with our Data Interpretation questions and answers to help you know what to expect, improve your speed and confidence and be really prepared for the actual test.

66.

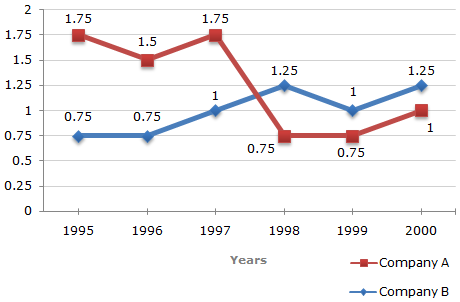
Answer the questions based on the given line graph.

Ratio of Exports to Imports (in terms of money in Rs. crores) of Two Companies Over the Years

In which year(s) was the difference between imports and exports of Company B the maximum?

A.

2000

B.

1996

C.

1998 and 2000

D.

Cannot be determined

Correct answer is D

We shall try to find the difference between the imports and exports of Company B for various years one by one:

For 1995: We have

E/I = 0.75

where E = amount of exports, I = amount of imports in 1995.

=> E = 0.75I

Therefore I - E = 0.75 x I = 0.25I.

Thus, the difference between the imports and exports of Company B in 1995 is dependent on the amount of imports of Company B in 1995.

Similarly, the difference for other years can be determined only if the amount of imports for these years is known.

Since the imports or exports for various years are not know, the differences between and exports for various years cannot be determined.

67.

Answer the questions based on the given line graph.

Ratio of Exports to Imports (in terms of money in Rs. crores) of Two Companies Over the Years

In 1995, the export of Company A was double that of Company B. If the imports of Company A during the year was Rs. 180 crores, what was the approximate amount of imports of Company B during that year?

A.

Rs. 190 crores

B.

Rs. 210 crores

C.

Rs. 225 crores

D.

Cannot be determined

Correct answer is B

In 1995 for Company A we have:

EA/IA = 1.75 ... (i)

[where EA = amount of exports, IA = amount of imports of Company a in 1995]

In 1995 for Company B we have:

EB/IB = 0.75 ... (ii)

[where EB = amount of exports, IB = amount of imports of Company B in 1995]

Also, we have EA = 2EB ... (iii)

Substituting IA = Rs. 180 crores (given) in (i), we get:

EA = Rs. (180 x 1.75) crores = Rs. 315 crores.

Using EA = Rs. 315 crores in (iii), we get:

EB = EA/2 = Rs. ( 315/2 ) crores. 

Substituting EB = Rs. ( 315/2 ) crores in (ii), we get:

IB = EB/0.75 = Rs. ( 315/(2 x 0.75) ) crores = Rs. 210 crores.

i.e., amount of imports of Company B in 1995 = Rs. 210 crores.

68.

Answer the questions based on the given line graph.

Ratio of Exports to Imports (in terms of money in Rs. crores) of Two Companies Over the Years

If the exports of Company A in 1998 were Rs. 237 crores, what was the amount of imports in that year?

A.

Rs. 189.6 crores

B.

Rs. 243 crores

C.

Rs. 281 crores

D.

Rs. 316 crores

Correct answer is D

Let the amount of imports of Company A in 1998 be Rs. x crores.

Then, 237/x = 0.75    =>    x = 237/0.75 = 316

Therefore Amount of imports of Company A in 1998 = Rs. 316 crores.

69.

Answer the questions based on the given line graph.

Ratio of Exports to Imports (in terms of money in Rs. crores) of Two Companies Over the Years

If the imports of Company A in 1997 were increased by 40 percent, what would be the ratio of exports to the increased imports?

A.

1.20

B.

1.25

C.

1.30

D.

Cannot be determined

Correct answer is B

In 1997 for Company A we have:

E/I = 1.75  i.e.,  E = 1.75I

where E amount of exports, I = amount of imports of Company A in 1997.

Now, the required imports I1 = I + 40% of I = 1.4I.

Therefore Required ratio = E/I1 = 1.75I/1.4I = 1.25.

70.

Answer the questions based on the given line graph.

Ratio of Exports to Imports (in terms of money in Rs. crores) of Two Companies Over the Years

In how many of the given years were the exports more than the imports for Company A?

A.

2

B.

3

C.

4

D.

5

Correct answer is B

The exports are more than imports in those years for which the exports to imports ratio are more than 1. For Company A, such years are 1995, 1996 and 1997.

Thus, during these 3 years, the exports are more than the imports for Company A.


Sub-categories

Line Charts