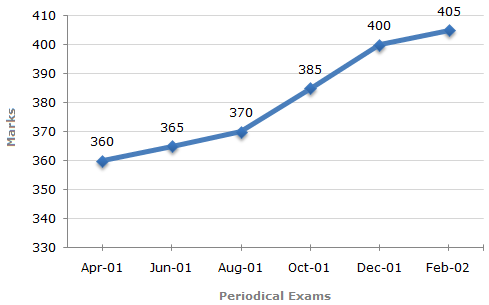
In a school the periodical examination are held every second month. In a session during April 2001 - March 2002, a student of Class IX appeared for each of the periodical exams. The aggregate marks obtained by him in each perodical exam are represented in the line-graph given below.
Marks Obtained by student in Six Periodical Held in Every Two Months During the Year in the Session 2001 - 2002.
Maximum Total Marks in each Periodical Exam = 500

None
June, 01
Oct, 01
Feb, 02
Correct answer is A
As is clear from the graph, the total marks obtained in periodical exams, go on increasing. Since, the maximum marks for all the periodical exams are the same; it implies that the percentage of marks also goes on increasing.
Thus, in none of the periodical exams, there is a fall in percentage of marks compared to the previous exam.
In a school the periodical examination are held every second month. In a session during April 2001 - March 2002, a student of Class IX appeared for each of the periodical exams. The aggregate marks obtained by him in each perodical exam are represented in the line-graph given below.
Marks Obtained by student in Six Periodical Held in Every Two Months During the Year in the Session 2001 - 2002.
Maximum Total Marks in each Periodical Exam = 500

373
379
381
385
Correct answer is C
Average marks obtained in all the periodical exams
= 1/6 x [360 + 365 + 370 + 385 + 400 + 405] = 380.83 ≈ 381.
In a school the periodical examination are held every second month. In a session during April 2001 - March 2002, a student of Class IX appeared for each of the periodical exams. The aggregate marks obtained by him in each perodical exam are represented in the line-graph given below.
Marks Obtained by student in Six Periodical Held in Every Two Months During the Year in the Session 2001 - 2002.
Maximum Total Marks in each Periodical Exam = 500

73.25%
75.5%
77%
78.75%
Correct answer is B
Required percentage = [ (370 + 385)/(500 + 500) x 100 ] % = ( 755/1000 x 100 ) % = 75.5%.
In a school the periodical examination are held every second month. In a session during April 2001 - March 2002, a student of Class IX appeared for each of the periodical exams. The aggregate marks obtained by him in each perodical exam are represented in the line-graph given below.
Marks Obtained by student in Six Periodical Held in Every Two Months During the Year in the Session 2001 - 2002.
Maximum Total Marks in each Periodical Exam = 500
110%
112.5%
115%
116.5%
Correct answer is B
Here it is clear from the graph that the student obtained 360, 365, 370, 385, 400 and 405 marks in periodical exams held in Apr 01, Jun 01, Aug 01, Oct 01, Dec 01 and Feb 02 respectively.
Required percentage = ( 405/360 x 100 ) % = 112.5%
In a school the periodical examination are held every second month. In a session during April 2001 - March 2002, a student of Class IX appeared for each of the periodical exams. The aggregate marks obtained by him in each perodical exam are represented in the line-graph given below.
Marks Obtained by student in Six Periodical Held in Every Two Months During the Year in the Session 2001 - 2002.
Maximum Total Marks in each Periodical Exam = 500

June, 01
August, 01
Oct, 01
Dec, 01
Correct answer is C
Percentage increase in marks in various periodical exams compared to the previous exams are:
For Jun 01 = [ (365 - 360)/360 x 100 ] % = 1.39%.
For Aug 01 = [ (370 - 365)/365 x 100 ] % = 1.37%.
For Oct 01 = [ (385 - 370)/370 x 100 ] % = 4.05%.
For Dec 01 = [ (400 - 385)/385 x 100 ] % = 3.90%.
For Feb 02 = [ (404 - 400)/400 x 100 ] % = 1.25%.
Clearly, highest percentage increase in marks is in Oct 01.
Aptitude Tests