Answer the questions based on the given line graph.
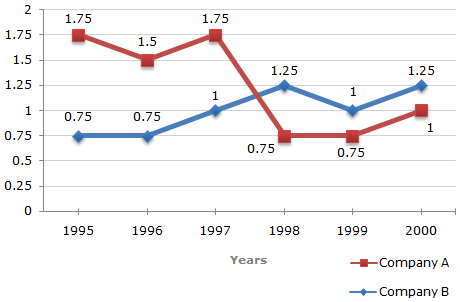
Ratio of Exports to Imports (in terms of money in Rs. crores) of Two Companies Over the Years
1.20
1.25
1.30
Cannot be determined
Correct answer is B
In 1997 for Company A we have:
E/I = 1.75 i.e., E = 1.75I
where E amount of exports, I = amount of imports of Company A in 1997.
Now, the required imports I1 = I + 40% of I = 1.4I.
Therefore Required ratio = E/I1 = 1.75I/1.4I = 1.25.
Answer the questions based on the given line graph.
Ratio of Exports to Imports (in terms of money in Rs. crores) of Two Companies Over the Years

In how many of the given years were the exports more than the imports for Company A?
2
3
4
5
Correct answer is B
The exports are more than imports in those years for which the exports to imports ratio are more than 1. For Company A, such years are 1995, 1996 and 1997.
Thus, during these 3 years, the exports are more than the imports for Company A.
The following line graph gives the annual percent profit earned by a Company during the period 1995 - 2000.
Percent Profit Earned by a Company Over the Years.
%Profit = (Income - Expenditure)/Expenditure x 100

During which year is the ratio of percentage profit earned to that in the previous year the minimum?
1996
1997
1998
1999
Correct answer is B
The ratio percentage profit earned to that in the previous year, for different years are:
For 1996 = 55/40 = 1.38;
For 1997 = 45/55 = 0.82;
For 1998 = 65/45 = 1.44;
For 1999 = 70/65 = 1.08;
For 2000 = 60/70 = 0.86;
Clearly, this ratio is minimum for 1997.
The following line graph gives the annual percent profit earned by a Company during the period 1995 - 2000.
Percent Profit Earned by a Company Over the Years.
%Profit = (Income - Expenditure)/Expenditure x 100
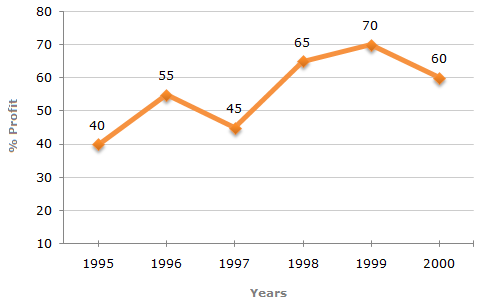
During which of the following year was the ratio of income to the expenditure the minimum?
1996
1997
1998
1999
Correct answer is B
It is given that :
% Profit = (Income - Expenditure)/Expenditure x 100
=> % Profit/100 = (Income/Expenditure) - 1
=> Income/Expenditure = (% Profit/ 100) + 1
From this it is clear that the ratio of income to expenditure is minimum for the year in which the % Profit has the minimum value. Since, out of given years (i.e., out of 1996, 1997, 1998, 1999 and 2000), the Company has the minimum % profit in the year 1997.
So the minimum ratio of income to expenditure is in the year 1997.
The following line graph gives the annual percent profit earned by a Company during the period 1995 - 2000.
Percent Profit Earned by a Company Over the Years.
%Profit = (Income - Expenditure)/Expenditure x 100

What is the average profit earned for the given years?
50(2/3)
55(5/6)
60(1/6)
335
Correct answer is B
Average percent profit earned for the given years
= 1/6 x [40 + 55 + 45 + 65 + 70 + 60] = 335/6 = 55(5/6)
Aptitude Tests