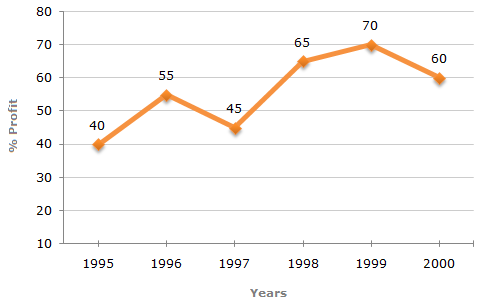
The following line graph gives the annual percent profit earned by a Company during the period 1995 - 2000.
Percent Profit Earned by a Company Over the Years.
%Profit = (Income - Expenditure)/Expenditure x 100

If the profit in 1999 was Rs. 4 crores, what was the profit in 2000?
Rs. 4.2 crores
Rs. 6.6 crores
Rs. 6.8 crores
Cannot be determined
Correct answer is D
From the line-graph we obtain information about the percentage profit only. To find the profit in 2000 we must have the data for the income or expenditure in 2000.
Therefore, the profit for 2000 cannot be determined.
The following line graph gives the annual percent profit earned by a Company during the period 1995 - 2000.
Percent Profit Earned by a Company Over the Years.
%Profit = (Income - Expenditure)/Expenditure x 100
In which year is the expenditure minimum?
2000
1997
1996
Cannot be determined
Correct answer is D
The line-graph gives the comparison of percent profit for different years bu the comparison of the expenditures is not possible without more data.
Therefore, the year with minimum expenditure cannot be determined.
The following line graph gives the annual percent profit earned by a Company during the period 1995 - 2000.
Percent Profit Earned by a Company Over the Years.
%Profit = (Income - Expenditure)/Expenditure x 100

If the income in 1998 was Rs. 264 crores, what was the expenditure in 1998?
Rs. 104 crores
Rs. 145 crores
Rs. 160 crores
Rs. 185 crores
Correct answer is C
Let the expenditure is 1998 be Rs. x crores.
Then, 65 = ((264 - x)/x) x 100
=> 65/100 = (264/x) - 1
=> x = (264 x100)/165 = 160.
Therefore Expenditure in 1998 = Rs. 160 crores.
The following line graph gives the annual percent profit earned by a Company during the period 1995 - 2000.
Percent Profit Earned by a Company Over the Years.
%Profit = (Income - Expenditure)/Expenditure x 100

1:1
2:3
13:14
9:10
Correct answer is D
Let the expenditure in 1996 = x.
Also, let the incomes in 1996 and 1999 be I1 and I2 respectively.
Then, for the year 1996, we have:
55 = (I1 - x)/x x 100 => 55/100 = I1/x - 1 => I1 = 155x/100 ... (i)
70 = (I2 - x)/x x 100 => 70/100 = I2/x - 1 => I2 = 170x/100 ... (ii)
From (i) and (ii), we get:
I1/I2 = (155x/100)/(170x/100) = 155/170 ≈ 0.91/1 ≈ 9 : 10
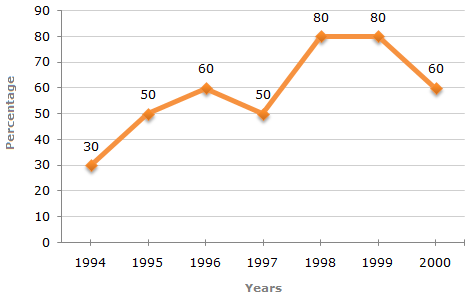
The following line graph gives the percentage of the number of candidates who qualified for an examination out of the total number of candidates who appeared for the examination over a period of seven years from 1994 to 2000.
Percentage of Candidates who Qualified to Appeared in an Examination Over the Years
24500
22000
20500
19000
Correct answer is C
The number of candidates qualified in 1999 = (80% of 26500) = 21200.
Therefore Number of candidates qualified in 2000 = (33500 - 21200) = 12300.
Let the number of candidates appeared in 2000 be x.
Then, 60% of x = 12300 => x = ( (12300 x 100)/60 ) = 20500
Aptitude Tests