Data Interpretation questions and answers

Data Interpretation Questions and Answers

Data Interpretation questions test one's ability in analysing data, inspecting the elements in data and interpreting them to extract maximum information from the given set of data or information. The data is usually given in the form of charts, tables and graphs.

Practise with our Data Interpretation questions and answers to help you know what to expect, improve your speed and confidence and be really prepared for the actual test.

41.

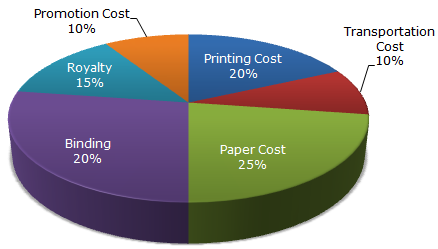
The following pie-chart shows the percentage distribution of the expenditure incurred in publishing a book. Study the pie-chart and the answer the questions based on it.

Various Expenditures (in percentage) Incurred in Publishing a Book

If for an edition of the book, the cost of paper is Rs. 56250, then find the promotion cost for this edition.

A.

Rs. 20,000

B.

Rs. 22,500

C.

Rs. 25,500

D.

Rs. 28,125

Correct answer is B

Let the Promotion Cost for this edition be Rs. p.

Then, 25 : 10 = 56250 : p    =>    p = Rs. ( (56250 x 10)/25 ) = Rs. 22,500

42.

The following pie-chart shows the percentage distribution of the expenditure incurred in publishing a book. Study the pie-chart and the answer the questions based on it.

Various Expenditures (in percentage) Incurred in Publishing a Book

For an edition of 12,500 copies, the amount of Royalty paid by the publisher is Rs. 281,250. What should be the selling price of the book if the publisher desires a profit of 5%?

A.

Rs. 152.50

B.

Rs. 157.50

C.

Rs. 162.50

D.

Rs. 167.50

Correct answer is B

Clearly, S.P. of the book = 105% of C.P.

Let the selling price of this edition (of 12500 books) be Rs. x.

Then, 15 : 105 = 281250 : x   =>   x = Rs. ( (105 x 281250)/15 ) = Rs. 1968750

Therefore S.P. of one book = Rs. ( 1968750/12500 ) = Rs. 157.50

43.

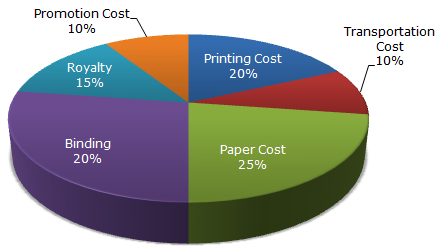
The following pie-chart shows the percentage distribution of the expenditure incurred in publishing a book. Study the pie-chart and the answer the questions based on it.

Various Expenditures (in percentage) Incurred in Publishing a Book

If the difference between the two expenditures are represented by 18° in the pie-chart, then these expenditures possibly are

A.

Binding Cost and Promotion Cost

B.

Paper Cost and Royalty

C.

Binding Cost and Printing Cost

D.

Paper Cost and Printing Cost

Correct answer is D

Central angle of 18° = ( 18/360 x 100 ) % of the total expenditure

= 5% of the total expenditure.

From the given chart it is clear that:

Out of the given combinations, only in combination (d) the difference is 5% i.e.

Paper Cost - Printing Cost = (25% - 20%) of the total expenditure

= 5% of the total expenditure.

44.

The following pie-chart shows the percentage distribution of the expenditure incurred in publishing a book. Study the pie-chart and the answer the questions based on it.

Various Expenditures (in percentage) Incurred in Publishing a Book

Royalty on the book is less than the printing cost by:

A.

5%

B.

10%

C.

20%

D.

25%

Correct answer is D

Printing Cost of book = 20% of C.P.

Royalty on book = 15% of C.P.

Difference = (20% of C.P.) - (15% of C.P) = 5% of C.P.

Therefore Percentage difference = ( Difference/Printing Cost x 100 ) %

= ( (5% of C.P.)/Printing Cost x 100 ) % = 25%

45.

The following pie-chart shows the percentage distribution of the expenditure incurred in publishing a book. Study the pie-chart and the answer the questions based on it.

Various Expenditures (in percentage) Incurred in Publishing a Book

If 5500 copies are published and the transportation cost on them amounts to Rs. 82500, then what should be the selling price of the book so that the publisher can earn a profit of 25%?

A.

Rs. 187.50

B.

Rs. 191.50

C.

Rs. 175

D.

Rs. 180

Correct answer is A

For the publisher to earn a profit of 25%, S.P. = 125% of C.P.

Also Transportation Cost = 10% of C.P.

Let the S.P. of 5500 books be Rs. x.

Then, 10 : 125 = 82500 : x   =>   x = Rs. ( (125 x 82500)/10 ) = Rs. 1031250

Therefore S.P. of one book = Rs. ( 1031250/5500 ) = Rs. 187.50


Sub-categories

Pie Charts