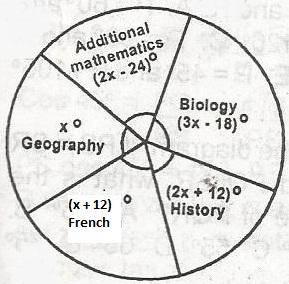
In a class of 60 pupils, the statistical distribution of ...

In a class of 60 pupils, the statistical distribution of the numbers of pupils offering Biology, History, French, Geography and Additional mathematics is as shown in the pie chart. How many pupils offer Additional Mathematics?
15
10
18
12
20
Correct answer is B
(2x - 24)° + (3x - 18)° + (2x + 12)° + (x + 12)° + x° = 360°
9x = 360° + 18°
x = \(\frac{378}{9}\)
= 42°, if x = 42°, then add maths = \(\frac{2x - 42}{360}\) x 60
= \(\frac{2 \times 42 - 24}{360}\) x 60
= \(\frac{84 - 24}{6}\)
Similar Questions
Evaluate \(\int^{1}_{0}\)(3 - 2x)dx...
Find the size of each exterior angle of a regular octagon ...
An arc of a circle of radius 14cm subtends angle 300° at the centre. Find the perimeter of the s...
A die with faces numbered 1 to 6 is rolled once. What is the probability of obtaining 4?...
Solve the equation \(\frac{2y-1}{3} - \frac{3y-1}{4} = 1\) ...
A trader realises 10x - x\(^2\) Naira profit from the sale of x bags of corn. How many bags wil...
From the figure, calculate TH in centimeters ...
The bearing of P from Q is x, where 270o < x < 360o. Find the bearing of Q from P...