The pie chart shows the distribution of 4320 students who...

The pie chart shows the distribution of 4320 students who graduated from four departments in a university. If a student is picked at random from the four departments, what id the probability that he is not from the education department?
\(\frac{3}{10}\)
\(\frac{2}{9}\)
\(\frac{5}{18}\)
\(\frac{7}{10}\)
Correct answer is D
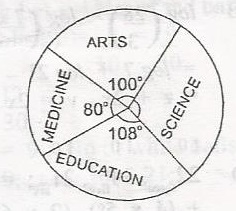
\(\frac{\text{education}}{\text{graduates}} = \frac{108}{360} \times 4320\)
= 1296
Pr(Education) = \(\frac{1296}{4320} = \frac{1}{10}\)
pr(not education) = 1 - \(\frac{3}{10}\)
= \(\frac{10 - 3}{10}\)
= \(\frac{7}{10}\)
Similar Questions
Find the value of a if log\(_{10}\) a + log\(_{10}\)a\(^2\) = 0.9030...
If P(2,3) and Q)2, 5) are points on a graph, calculate the length PQ ...
Given that y = px + q and y = 5 when x = 3, while y = 4 when x = 2, find the value of p and q. ...
Simplify \(\frac{a - b}{a + b}\) - \(\frac{a + b}{a - b}\)...
Solve the equation \( 3x^2 − 4x − 5 = 0 \)...
What are the values of y which satisfy the equation \(9^{y} - 4 \times 3^{y} + 3 = 0\) ?...