The graph above depicts the performance ratings of two sp...

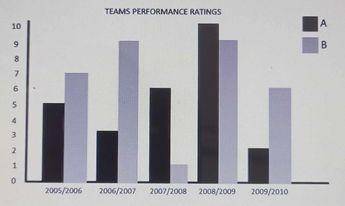
The graph above depicts the performance ratings of two sports teams A and B in five different seasons
In the last five seasons, what was the difference in the average performance ratings between Team B and Team A?
1.2
6.4
4.6
1.8
Correct answer is A
Average performance rating of Team B = \(\frac{7+9+1+9+6}{5} = \frac{32}{5}\) = 6.4
Average performance rating of Team A = \(\frac{5+3+6+10+2}{5} = \frac{26}{5}\) = 5.2
∴ The difference in the average performance ratings between Team B and Team A = 6.4 - 5.2 = 1.2
Similar Questions
PQ is parallel to RS. Calculate the value of x. ...
From a point P, Q is 5km due West and R is12km due South of Q. Find the distance between P...
If \(\cos^2 \theta + \frac{1}{8} = \sin^2 \theta\), find \(\tan \theta\)....
Evaluate \(\int_{0} ^{\frac{\pi}{2}} \sin x \mathrm d x\)...