The diagram above shows the velocity-time graph of a vehi...

The diagram above shows the velocity-time graph of a vehicle. Its acceleration and retardation respectively are
A.
8.0 ms-2, 4,0 ms-2
B.
4.0 ms-2, 8.0 ms-2
C.
4.0 ms-2, 2.0 ms-2
D.
2.0 ms-2, 4.0 ms-2
Correct answer is C
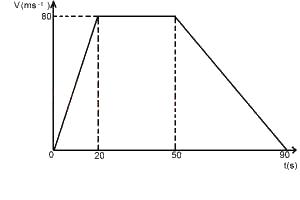
Acceleration = slope = AE/OE = 80/20 = 4m/s2
∴ acceleration and retardation = 4m/s2; 2m/s2
Similar Questions
The correct sequence of energy transformation in the operation of an x-ray tube is i. X-rays ii....
When a telescope is in normal use, the final image is at ...
A body moves with a constant speed but has an acceleration. This is possible if it ...
Which is a stringed Instrument? ...
The fuse in an electric device is always connected to the ...