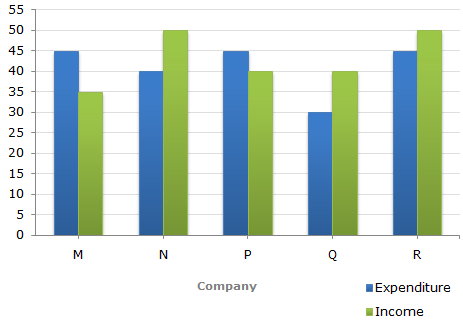
The following bar graph shows the Income and Expenditures (in million US $) of five companies in the year 2001. The percent profit or loss of a company is given by
% Profit/Loss = (Income - Expenditure)/Expenditure x 100
Income and Expenditure (in million US $) of five companies in the year 2001.

28.28
30.30
32.32
34.34
Correct answer is B
Let the income of Company Q in 2001 = x million US $.
Then, income of Company in 2001 = ( 110/100 x x ) million US $.
Therefore 110x/100 = 40 => x = ( 400/11 )
i.e., income of Company Q in 2000 = ( 400/11 ) million US $.
Let the expenditure of Company Q in 2000 be E million US $.
Then, 20 = [(400/11) - E]/E x 100 [because %Profit = 20% ]
=> 20 = [ ( 400/11E ) - 1 ] x 100
=> E = 400/11 x 100/120 = 30.30
Therefore Expenditure of Company Q in 2000 = 30.30 million US $.
The following bar graph shows the Income and Expenditures (in million US $) of five companies in the year 2001. The percent profit or loss of a company is given by
% Profit/Loss = (Income - Expenditure)/Expenditure x 100
Income and Expenditure (in million US $) of five companies in the year 2001.

35.75
37.25
38.5
41.25
Correct answer is D
Let the expenditure of Company R in 2000 be X million US $.
Then, expenditure of Company R in 2001 = ( (120/100) x x ) million US $
Therefore 120x/100 = 45 => x = 37.5
i.e., expenditure of Company R in 2000 = 37.5 million US $
Let the income of Company R in 2000 be I million US $.
Then, 10 = (I - 37.5)/37.5 x 100 [ ∵ %Profit in 2000 = 10%]
=> I - 37.5 = 3.75
=> I = 41.25
i.e., Income of Company R in 2000 = 41.25 million US $.
The following bar graph shows the Income and Expenditures (in million US $) of five companies in the year 2001. The percent profit or loss of a company is given by
% Profit/Loss = (Income - Expenditure)/Expenditure x 100
Income and Expenditure (in million US $) of five companies in the year 2001.

Which company earned the maximum percentage profit in the year 2001?
M
N
P
Q
Correct answer is D
The percentage profit/loss in the year 2001 for various comapanies are:
For M = [ (35 - 45)/45 x 100 ] % = -22.22% i.e., Loss = 22.22%
For N = [ (50 - 40)/40 x 100 ] % = 25% i.e., Profit = 25%
For P = [ (40 - 45)/45 x 100 ] % = -11.11% i.e., Loss = 11.11%
For Q = [ (40 - 30)/30 x 100 ] % = 33.33% i.e., Profit = 33.33%
For R = [ (50 - 45)/45 x 100 ] % = 11.11% i.e., Profit = 11.11%
Clearly, the Company Q earned the maximum profit in 2001.
The following bar graph shows the Income and Expenditures (in million US $) of five companies in the year 2001. The percent profit or loss of a company is given by
% Profit/Loss = (Income - Expenditure)/Expenditure x 100
Income and Expenditure (in million US $) of five companies in the year 2001.
5% profit
6.5% profit
4% loss
7% loss
Correct answer is A
Total income of all five companies
= (35 + 50 + 40 + 40 + 50) million US $
= 215 million US $.
Total expenditure of all five companies
= (45 + 40 + 45 + 30 + 45) million US $
= 205 million US $.
Therefore % Profit = [ (215 - 205)/205 x 100 ] % = 4.88% ≈ 5%
The following bar graph shows the Income and Expenditures (in million US $) of five companies in the year 2001. The percent profit or loss of a company is given by
% Profit/Loss = (Income - Expenditure)/Expenditure x 100
Income and Expenditure (in million US $) of five companies in the year 2001.

The companies M and N together had a percentage of profit/loss of?
12% loss
10% loss
10% profit
There was no loss or profit
Correct answer is D
Total income of Companies M and N together
= (35 + 50) million US $
= 85 million US $
Total expenditure of Companies M and N together
= (45 + 40) million US $
= 85 million US $.
Therefore Percent Profit/Loss of companies M and N together
% Profit/Loss = ( (85 - 85)/85 x 100 ) = 0%.
Thus, there was neither loss nor profit for companies M and N together.
Aptitude Tests
Latest Jobs
HR and Administration Officer at CBM Global Disability Inclusion
Storekeeper at Transgeneration Enterprises Limited
Volunteer HR Manager at Sim Impacting Lives Foundation
Partnerships and Network Lead at Adewunmi Desalu Parkinson's Foundation
Account Officer at Bons Industries Limited
Manager - Sales and Trade Development, Lagos Boundary at MTN Nigeria
Permit to Work Coordinator at WTS Energy
Business Development Executive at ARCO Worldwide Services Limited
Human Rights Volunteer at Stand To End Rape Initiative (STER)