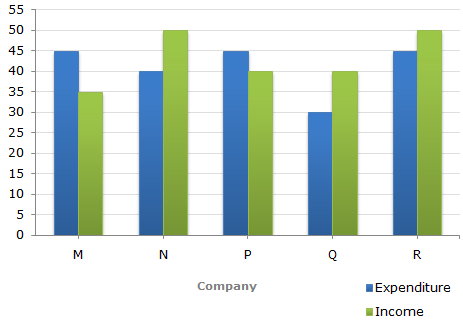
The following bar graph shows the Income and Expenditures (in million US $) of five companies in the year 2001. The percent profit or loss of a company is given by
% Profit/Loss = (Income - Expenditure)/Expenditure x 100
Income and Expenditure (in million US $) of five companies in the year 2001.

28.28
30.30
32.32
34.34
Correct answer is B
Let the income of Company Q in 2001 = x million US $.
Then, income of Company in 2001 = ( 110/100 x x ) million US $.
Therefore 110x/100 = 40 => x = ( 400/11 )
i.e., income of Company Q in 2000 = ( 400/11 ) million US $.
Let the expenditure of Company Q in 2000 be E million US $.
Then, 20 = [(400/11) - E]/E x 100 [because %Profit = 20% ]
=> 20 = [ ( 400/11E ) - 1 ] x 100
=> E = 400/11 x 100/120 = 30.30
Therefore Expenditure of Company Q in 2000 = 30.30 million US $.
The following bar graph shows the Income and Expenditures (in million US $) of five companies in the year 2001. The percent profit or loss of a company is given by
% Profit/Loss = (Income - Expenditure)/Expenditure x 100
Income and Expenditure (in million US $) of five companies in the year 2001.

35.75
37.25
38.5
41.25
Correct answer is D
Let the expenditure of Company R in 2000 be X million US $.
Then, expenditure of Company R in 2001 = ( (120/100) x x ) million US $
Therefore 120x/100 = 45 => x = 37.5
i.e., expenditure of Company R in 2000 = 37.5 million US $
Let the income of Company R in 2000 be I million US $.
Then, 10 = (I - 37.5)/37.5 x 100 [ ∵ %Profit in 2000 = 10%]
=> I - 37.5 = 3.75
=> I = 41.25
i.e., Income of Company R in 2000 = 41.25 million US $.
The following bar graph shows the Income and Expenditures (in million US $) of five companies in the year 2001. The percent profit or loss of a company is given by
% Profit/Loss = (Income - Expenditure)/Expenditure x 100
Income and Expenditure (in million US $) of five companies in the year 2001.

Which company earned the maximum percentage profit in the year 2001?
M
N
P
Q
Correct answer is D
The percentage profit/loss in the year 2001 for various comapanies are:
For M = [ (35 - 45)/45 x 100 ] % = -22.22% i.e., Loss = 22.22%
For N = [ (50 - 40)/40 x 100 ] % = 25% i.e., Profit = 25%
For P = [ (40 - 45)/45 x 100 ] % = -11.11% i.e., Loss = 11.11%
For Q = [ (40 - 30)/30 x 100 ] % = 33.33% i.e., Profit = 33.33%
For R = [ (50 - 45)/45 x 100 ] % = 11.11% i.e., Profit = 11.11%
Clearly, the Company Q earned the maximum profit in 2001.
The following bar graph shows the Income and Expenditures (in million US $) of five companies in the year 2001. The percent profit or loss of a company is given by
% Profit/Loss = (Income - Expenditure)/Expenditure x 100
Income and Expenditure (in million US $) of five companies in the year 2001.
5% profit
6.5% profit
4% loss
7% loss
Correct answer is A
Total income of all five companies
= (35 + 50 + 40 + 40 + 50) million US $
= 215 million US $.
Total expenditure of all five companies
= (45 + 40 + 45 + 30 + 45) million US $
= 205 million US $.
Therefore % Profit = [ (215 - 205)/205 x 100 ] % = 4.88% ≈ 5%
The following bar graph shows the Income and Expenditures (in million US $) of five companies in the year 2001. The percent profit or loss of a company is given by
% Profit/Loss = (Income - Expenditure)/Expenditure x 100
Income and Expenditure (in million US $) of five companies in the year 2001.

The companies M and N together had a percentage of profit/loss of?
12% loss
10% loss
10% profit
There was no loss or profit
Correct answer is D
Total income of Companies M and N together
= (35 + 50) million US $
= 85 million US $
Total expenditure of Companies M and N together
= (45 + 40) million US $
= 85 million US $.
Therefore Percent Profit/Loss of companies M and N together
% Profit/Loss = ( (85 - 85)/85 x 100 ) = 0%.
Thus, there was neither loss nor profit for companies M and N together.
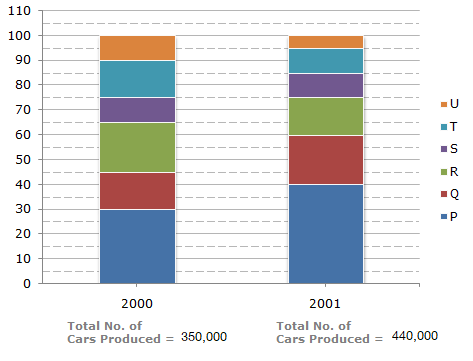
The bar graph given below shows the percentage distribution of the total production of a car manufacturing company into various models over two years.
Percentage of Six different types of Cars manufactured by a Company over Two Years

For which model is the percentage rise/fall in production from 2000 to 2001 the minimum?
Q
R
S
T
Correct answer is B
The percentage change (rise/fall) in production from 2000 to 2001 for various models is:
For P = [ (176000 - 105000)/105000 x 100 ] % = 67.62%, rise.
For Q = [ (88000 - 52500)/52500 x 100 ] % = 67.62%, rise.
For R = [ (70000 - 66000)/70000 x 100 ] % = 5.71%, fall.
For S = [ (44000 - 35000)/35000 x 100 ] % = 25.71%, rise.
For T = [ (52500 - 44000)/52500 x 100 ] % = 16.19%, fall.
For U = [ (35000 - 22000)/35000 x 100 ] % = 37.14%, fall.
Therefore Minimum percentage rise/fall in production is the case of model R.
The bar graph given below shows the percentage distribution of the total production of a car manufacturing company into various models over two years.
Percentage of Six different types of Cars manufactured by a Company over Two Years

7,650
9,350
11,850
12,250
Correct answer is C
Number of S type cars which remained unsold in 2000 = 15% of 35,000
and number of S type cars which remained unsold in 2001 = 15% of 44,000.
Therefore Total number of S type cars which remained unsold
= 15% of (35,000 + 44,000)
= 15% of 79,000
= 11,850.
The bar graph given below shows the percentage distribution of the total production of a car manufacturing company into various models over two years.
Percentage of Six different types of Cars manufactured by a Company over Two Years

140,000
132,000
117,000
105,000
Correct answer is B
If the percentage production of P type cars in 2001
= Percentage production of P type cars in 2000
= 30%.
then, number of P type cars produced in 2001
= 30% of 440,000
= 132,000.
The bar graph given below shows the percentage distribution of the total production of a car manufacturing company into various models over two years.
Percentage of Six different types of Cars manufactured by a Company over Two Years

Total number of cars of models P, Q and T manufactured in 2000 is?
245,000
227,500
210,000
192,500
Correct answer is C
Analysis of the graph:
We shall first determine the number of cars of each model produced by the Company during the two years:
In 2000 : Total number of cars produced = 3,50,000.
P = (30 - 0)% of 350,000 = 30% of 350,000 = 105,000.
Q = (45 - 30)% of 350,000 = 15% of 350,000 = 52,500.
R = (65 - 45)% of 350,000 = 20% of 350,000 = 70,000.
S = (75 - 65)% of 350,000 = 10% of 350,000 = 35,000.
T = (90 - 75)% of 350,000 = 15% of 350,000 = 52,500.
U = (100 - 90)% of 350,000 = 10% of 350,000 = 35,000.
In 2001 : Total number of cars produced = 4,40,000.
P = (40 - 0)% of 440,000 = 40% of 440,000 = 176,000.
Q = (60 - 40)% of 440,000 = 20% of 440,000 = 88,000.
R = (75 - 60)% of 440,000 = 15% of 440,000 = 66,000.
S = (85 - 75)% of 440,000 = 10% of 440,000 = 44,000.
T = (95 - 85)% of 440,000 = 10% of 440,000 = 44,000.
U = (100 - 95)% of 440,000 = 5% of 440,000 = 22,000.
Total number of cars of models P, Q and T manufacture in 2000
= (105000 + 52500 + 52500)
= 210,000.
The bar graph given below shows the percentage distribution of the total production of a car manufacturing company into various models over two years.
Percentage of Six different types of Cars manufactured by a Company over Two Years
What was the difference in the number of Q type cars produced in 2000 and that produced in 2001?
35,500
27,000
22,500
17,500
Correct answer is A
Total number of Q type cars produced in 2001
=(60 - 40)% of 4,40,000 = 88,000.
Total number of Q type cars produced in 2000
=(45 - 30)% of 3,50,000 = 52,500.
Therefore Required difference = (88000 - 52500) = 35,500.
Aptitude Tests
Latest Jobs
Information and Communication Manager at Nigerian Breweries Plc
Area Sales Manager at Airtel Nigeria
State Business Manager at Airtel Nigeria
Regional Technical Officer at Airtel Nigeria
Business Manager at Airtel Nigeria
Contract Administrator at Robert Walters
Import & Export Manager at Kerildbert Holdings Limited
JV Account Payable Officer at WTS Energy
HR Intern, Learning and Development at MainOne Cable
Senior Technical Officer - Endemic Diseases & NTDs (AfCDC) at the African Union