Data Interpretation questions test one's ability in analysing data, inspecting the elements in data and interpreting them to extract maximum information from the given set of data or information. The data is usually given in the form of charts, tables and graphs.
Practise with our Data Interpretation questions and answers to help you know what to expect, improve your speed and confidence and be really prepared for the actual test.
Study the following line graph and answer the questions.
Exports from Three Companies Over the Years (in Rs. crore)
87.12%
89.64%
91.21%
93.33%
Correct answer is D
Analysis of the graph: From the graph it is clear that
The amount of exports of Company X (in crore Rs.) in the years 1993, 1994, 1995, 1996, 1997, 1998 and 1999 are 30, 60, 40, 70, 100, 50 and 120 respectively.
The amount of exports of Company Y (in crore Rs.) in the years 1993, 1994, 1995, 1996, 1997, 1998 and 1999 are 80, 40, 60, 60, 80, 100 and 140 respectively.
The amount of exports of Company Z (in crore Rs.) in the years 1993, 1994, 1995, 1996, 1997, 1998 and 1999 are 60, 90,, 120, 90, 60, 80 and 100 respectively.
Average annual exports (in Rs. crore) of Company Y during the given period
= 1/7 x (80 + 40 + 60 + 60 + 80 + 100 + 140) = 560/7 = 80
Average annual exports (in Rs. crore) of Company Z during the given period
= 1/7 x (60 + 90 + 120 + 90 + 60 + 80 + 100) = ( 600/7 )
Therefore Required percentage = [ 80/( 600/7 ) x 100 ] % ≈ 93.33%.
Study the following line graph and answer the questions.
Exports from Three Companies Over the Years (in Rs. crore)
1995 and 1998
1996 and 1998
1997 and 1998
1995 and 1996
Correct answer is D
Total exports of the three Companies X, Y and Z together, during various years are:
In 1993 = Rs. (30 + 80 + 60) crores = Rs. 170 crores.
In 1994 = Rs. (60 + 40 + 90) crores = Rs. 190 crores.
In 1995 = Rs. (40 + 60 + 120) crores = Rs. 220 crores.
In 1996 = Rs. (70 + 60 + 90) crores = Rs. 220 crores.
In 1997 = Rs. (100 + 80 + 60) crores = Rs. 240 crores.
In 1998 = Rs. (50 + 100 + 80) crores = Rs. 230 crores.
In 1999 = Rs. (120 + 140 + 100) crores = Rs. 360 crores.
Clearly, the total exports of the three Companies X, Y and Z together are same during the years 1995 and 1996.
The following table gives the percentage distribution of population of five states, P, Q, R, S and T on the basis of poverty line and also on the basis of sex.
1:3
2:5
3:7
4:9
Correct answer is B
For State Q:
Male population below poverty line = 2.4 million.
Let the female population below poverty line be x million.
Then, 3 : 5 = 2.4 : x => x = (5 x 2.4)/3 = 4
Therefore Total population below poverty line = (2.4 + 4) = 6.4 million.
If Nq be the total population of State Q, then,
25% of Nq = 6.4 million => Nq = ( (6.4 x 100)/25 ) million = 25.6 million.
For State T:
Male population below poverty line = 6 million.
Let the female population below poverty line be y million.
Then, 5 : 3 = 6 : y => y = (3 x 6)/5 = 3.6
Therefore Total population below poverty line = (6 + 3.6) = 9.6 million.
If Nt be the total population of State T, then,
15% of Nt = 9.6 million => Nt = ( (9.6 x 100)/15 ) million = 64 million.
Thus, Required ratio = Nq/Nt = 25.6/64 = 0.4 = 2.5
The following table gives the percentage distribution of population of five states, P, Q, R, S and T on the basis of poverty line and also on the basis of sex.
2.1 million
2.3 million
2.7 million
3.3 million
Correct answer is D
Female population below poverty line for State P = 2.1 million
Let the male population below poverty line for State P be x million.
Then, 5 : 6 = x : 21 => x = (2.1 x 5)/6 = 1.75
Therefore Population below poverty line for State P = (2.1 + 1.75) million = 3.85 million.
Let the population above poverty line for State P be y million.
Since, 35% of the total population of State P is below poverty line, therefore, 65% of the total population of State P is above poverty line i.e., the ratio of population below poverty line to that above poverty line for State P is 35 : 65.
Therefore 35 : 65 = 3.85 : y => y = (65 x 3.85)/35 = 7.15
Therefore Population above poverty line for State P = 7.15 million and so, male population above poverty line for State P
= ( 6/13 x 7.15 ) million
= 3.3 million
The following table gives the percentage distribution of population of five states, P, Q, R, S and T on the basis of poverty line and also on the basis of sex.
3 million
2.43 million
1.33 million
5.7 million
Correct answer is B
Total population of State S = 7 million.
Therefore Population above poverty line
= [(100 - 19)% of 7] million
= (81% of 7) million
= 5.67 million.
And so, the number of females above poverty line in State S
= ( 3/7 x 5.67 ) million
= 2.43 million.
The following table gives the percentage distribution of population of five states, P, Q, R, S and T on the basis of poverty line and also on the basis of sex.
4.5 million
4.85 million
5.35 million
6.25 million
Correct answer is D
Let the total population of State R be x million.
Then, population of State R above poverty line
= [(100 - 24)% of x] million
= ( 76/100 x x ) million
And so, male population of State R above poverty line
= [ 2/5 x ( 76/100 x x ) ] million
But, it is given that male population of State R above poverty line= 1.9 million.
Therefore 2/5 x ( 76/100 x x ) = 1.9 => x = (5 x 100 x 1.9)/76 x 2 = 6.25
Therefore Total population of State R = 6.25 million.
The following table shows the number of new employees added to different categories of employees in a company and also the number of employees from these categories who left the company every year since the foundation of the Company in 1995.
19%
21%
27%
29%
Correct answer is D
Total number of Operators who left the Company during 1995 - 2000
= (104 + 120 + 100 + 112 + 144)
= 580.
Total number of Operators who joined the Company during 1995 - 2000
= (880 + 256 + 240 + 208 + 192 + 248)
= 2024.
Therefore Required Percentage
= ( 580/2024 x 100 ) %
= 28.66%
≈ 29%.
The following table shows the number of new employees added to different categories of employees in a company and also the number of employees from these categories who left the company every year since the foundation of the Company in 1995.
What is the pooled average of the total number of employees of all categories in the year 1997?
1325
1195
1265
1235
Correct answer is B
Total number of employees of various categories working in the Company in 1997 are:
Managers = (760 + 280 + 179) - (120 + 92) = 1007.
Technicians = (1200 + 272 + 240) - (120 + 128) = 1464.
Operators = (880 + 256 + 240) - (104 + 120) = 1152.
Accountants = (1160 + 200 + 224) - (100 + 104) = 1380.
Peons = (820 + 184 + 152) - (96 + 88) = 972.
Therefore Pooled average of all the five categories of employees working in the Company in 1997
= 1/5 x (1007 + 1464 + 1152 + 1380 + 972)
= 1/5 x (5975)
= 1195.
The following table shows the number of new employees added to different categories of employees in a company and also the number of employees from these categories who left the company every year since the foundation of the Company in 1995.
Managers
Technicians
Operators
Accountants
Correct answer is A
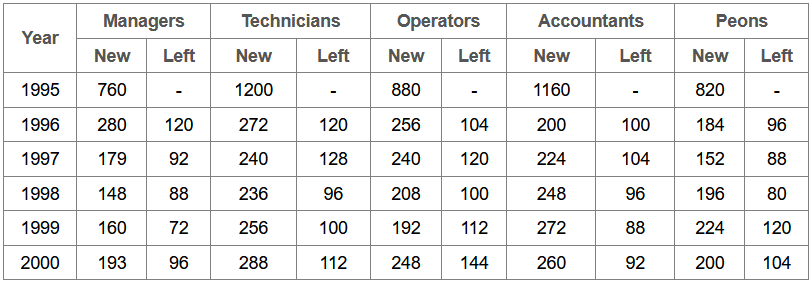
Number of Managers working in the Company:
In 1995 = 760.
In 2000 = (760 + 280 + 179 + 148 + 160 + 193) - (120 + 92 + 88 + 72 + 96)
= 1252.
Therefore Percentage increase in the number of Managers
= [ (1252 - 760)/760 x 100 ] % = 64.74%.
Number of Technicians working in the Company:
In 1995 = 1200.
In 2000 = (1200 + 272 + 240 + 236 + 256 + 288) - (120 + 128 + 96 + 100 + 112)
= 1936.
Therefore Percentage increase in the number of Technicians
= [ (1936 - 1200)/1200 x 100 ] % = 61.33%.
Number of Operators working in the Company:
In 1995 = 880.
In 2000 = (880 + 256 + 240 + 208 + 192 + 248) - (104 + 120 + 100 + 112 + 144)
= 1444.
Therefore Percentage increase in the number of Operators
= [ (1444 - 880)/880 x 100 ] % = 64.09%.
Number of Accountants working in the Company:
In 1995 = 1160.
In 2000 = (1160 + 200 + 224 + 248 + 272 + 260) - (100 + 104 + 96 + 88 + 92)
= 1884.
Therefore Percentage increase in the number of Accountants
= [ (1884 - 1160)/1160 x 100 ] % = 62.41%.
Number of Peons working in the Company:
In 1995 = 820.
In 2000 = (820 + 184 + 152 + 196 + 224 + 200) - (96 + 88 + 80 + 120 + 104)
= 1288.
Therefore Percentage increase in the number of Peons = [ (1288 - 820)/820 x 100 ] % = 57.07%.
Clearly, the percentage increase is maximum in case of Managers
The following table shows the number of new employees added to different categories of employees in a company and also the number of employees from these categories who left the company every year since the foundation of the Company in 1995.
What was the total number of Peons working in the Company in the year 1999?
1312
1192
1088
968
Correct answer is B
Total number of Peons working in the Company in 1999
= (820 + 184 + 152 + 196 + 224) - (96 + 88 + 80 + 120)
= 1192
Ernst & Young (EY) Nigeria FY25 Graduate Trainee Recruitment 2024
Officer, Contact Centre at Stanbic IBTC Pension Managers Limited
State Data Assistant (Roster) at World Health Organization (WHO)
Production Clerk at Grand Oak Limited
Logistics Assistant at the Global Alliance for Improved Nutrition (GAIN)
Organisation Development Lead at British Council
Finance Officer at Global Alliance for Improved Nutrition (GAIN)
Head of Higher Education at British Council
Relationship Officer - Emerging Corporate at First City Monument Bank Limited (FCMB)