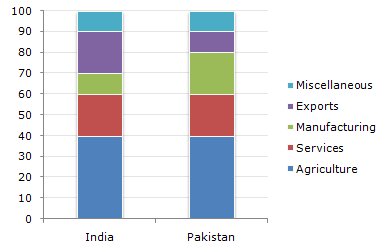
The following bar chart shows the composition of the GDP of two countries (India and Pakistan).
Composition of GDP of Two Countries
100 %
200 %
133.33 %
None of these
Correct answer is A
Since the GDP is same, the answer will be got by (40 - 20)/20 = 100%.
The following bar chart shows the composition of the GDP of two countries (India and Pakistan).
Composition of GDP of Two Countries

Which country accounts for higher earning out of Services and Miscellaneous together ?
India
Pakistan
Both spend equal amounts
Cannot be determined
Correct answer is D
Although the percentage on Services and Miscellaneous put together is equal for both the countries, we cannot comment on this since we have no data about the respective GDP's.
The following bar chart shows the composition of the GDP of two countries (India and Pakistan).
Composition of GDP of Two Countries

Rs.18,500 crore
Rs.18,000 crore
Rs.21,000 crore
Rs.15,000 crore
Correct answer is C
(40 + 20 + 10)% of 30,000 = Rs.21,000 crore.
The following bar chart shows the composition of the GDP of two countries (India and Pakistan).
Composition of GDP of Two Countries

What fraction of India's GDP is accounted for by Services ?
(6/33)th
(1/5)th
(2/3)rd
None of these
Correct answer is B
Service accounts for 20%, i.e., (1/5)th of the GDP of India.
The following bar chart shows the composition of the GDP of two countries (India and Pakistan).
Composition of GDP of Two Countries

If the total GDP of Pakistan is Rs. 10,000 crore, then a GDP accounted for by Manufacturing is ?
Rs.200 crore
Rs.600 crore
Rs.2,000 crore
Rs.6,000 crore
Correct answer is C
20% of 10000 = 2000
Aptitude Tests