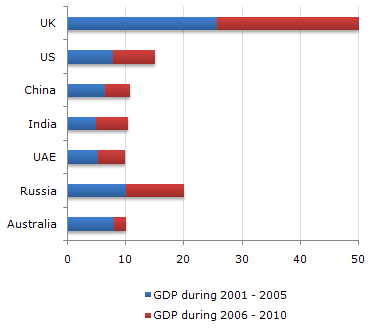
The following bar chart represents the GDP of different countries during the half decades 2001 - 2005 and 2006 - 2010. All figures are in Rs. billion.
GDP of Various Countries
UAE
US
India
China
Correct answer is B
It's clear that US is the highest amongst the given options.
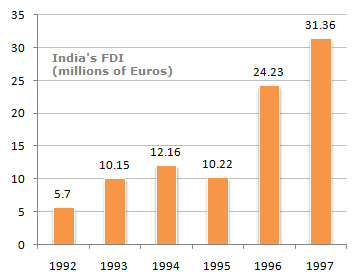
The following bar chart shows the trends of foreign direct investments(FDI) into India from all over the world.
Trends of FDI in India
What was India's total FDI for the period shown in the figure ?
93.82
93.22
93.19
None of these
Correct answer is A
Total FDI investment in the figure shown is = 5.7 + 10.15 + 12.16 + 10.22 + 24.23 + 31.36 = 93.82 billion.
The following bar chart shows the trends of foreign direct investments(FDI) into India from all over the world.
Trends of FDI in India

Which year exhibited the highest growth in FDI in India over the period shown ?
1993
1994
1995
1996
Correct answer is D
It can be seen that the FDI in 1996 more than doubles over that of 1995. No other year is close to that rate of growth.
The following bar chart shows the trends of foreign direct investments(FDI) into India from all over the world.
Trends of FDI in India

11
10.72
11.28
11.5
Correct answer is A
Let x be the FDI in 1997.
Then: (2/5.7) = (x/31.36)
x = (2/5.7) x 31.36
x = 11
The following bar chart shows the trends of foreign direct investments(FDI) into India from all over the world.
Trends of FDI in India

What was absolute difference in the FDI to India in between 1996 and 1997 ?
7.29
7.13
8.13
None of these
Correct answer is B
The difference in investments over 1996-1997 was
31.36 - 24.23 = € 7.13 millions.
Aptitude Tests