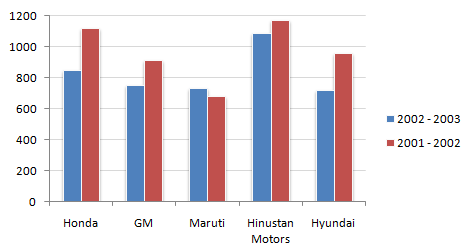
Study the following bar chart and answer the questions carefully.
Sales Turnover of 5 Companies (in Rs. crores)
Honda
GM
Hyundai
Maruti
Correct answer is C
Hyundai with 25.25 % is marginally higher than Honda with 24.5 %.
Study the following bar chart and answer the questions carefully.
Sales Turnover of 5 Companies (in Rs. crores)

712.43
142.48
683.53
None of these
Correct answer is A
Absolute value of the difference between the sum of the turnover of the five companies for 2001 - 2002 and 2002 - 2003.
Study the following bar chart and answer the questions carefully.
Sales Turnover of 5 Companies (in Rs. crores)

17.21 %
14.68 %
12.67 %
21.24 %
Correct answer is B
The required answer is
100 - percentage value of the fraction (Absolute change/first year's value).
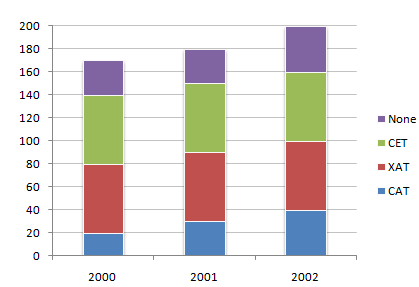
The following chart represents the number of students who passed the CAT exam or the XAT exam or the CET exam or None of these exams. (Assume that there are no students who passed more than one exam.)
Number of students who qualified for CAT/XAT/CET Exams
What is the percentage of students who cleared CAT in 2000 ?
19.56 %
12.65 %
14.28 %
11.76 %
Correct answer is D
Total percentage of students who cleared CAT in 2000 = (20 x 100)/170 = 11.76 %
The following chart represents the number of students who passed the CAT exam or the XAT exam or the CET exam or None of these exams. (Assume that there are no students who passed more than one exam.)
Number of students who qualified for CAT/XAT/CET Exams

What is the percentage increase in the number of students in 2002 over 2000 ?
30 %
17.64 %
117.6 %
85 %
Correct answer is B
Total percentage increase in the number of students in 2002 over 2000 is = (30 x 100)/170 = 17.64 %
Aptitude Tests