The following bar chart shows the trends of foreign direct investments(FDI) into India from all over the world.
Trends of FDI in India
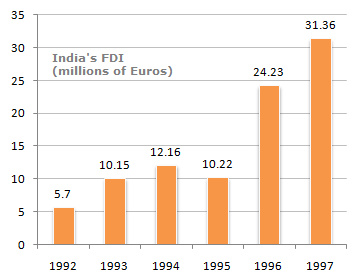
What was the ratio of investment in 1997 over the investment in 1992 ?
5.50
5.36
5.64
5.75
Correct answer is A
The 1997 figure of investment as a factor of 1992 investment = (31.36/5.70) = 5.50
Study the bar chart and answer the questions.
Sale of Cellular Phones

The percentage increase in sales from 2001 to 2002 was ?
115 %
128 %
122 %
118 %
Correct answer is C
The percentage increase exhibited is
((40 - 18)/18) x 100 = 122 % approximately.
Study the bar chart and answer the questions.
Sale of Cellular Phones

The sum of sales of cellular phones in the years 1999 and 2001 is equal to that in ?
1997
1998
2000
2002
Correct answer is A
The sum of sales in the two years is 30,000 + 18,000 = 48,000, which is the sales value for 1997.
Study the bar chart and answer the questions.
Sale of Cellular Phones

The two years between which the rate of change of cellular phones is minimum are ?
1997 and 1998
1999 and 2000
Both option (A) and (B)
2001 and 2002
Correct answer is C
The lowest rate of change for
For year 1997 and 1998 = ((48000 - 40000) / 40000) x 100 = 20%
For year 1999 and 2000 = ((30000 - 25000) / 25000) x 100 = 20%
is exhibited by both option (A) and (B).
Study the bar chart and answer the questions.
Sale of Cellular Phones
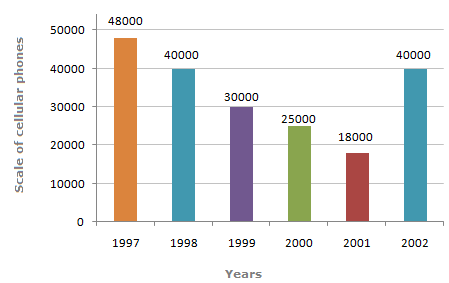
The difference in the sales of cellular phones for the years 1997 and 1999 is ?
500 units
1,000 units
5,000 units
18,000 units
Correct answer is D
The required answer is got by 48,000 - 30,000 = 18,000.
Aptitude Tests