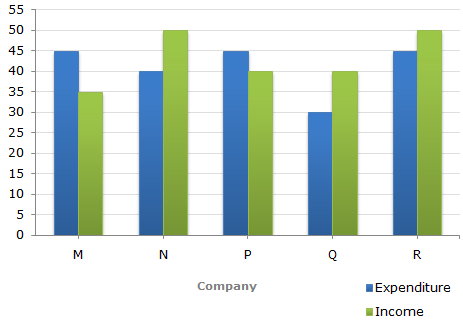
The following bar graph shows the Income and Expenditures (in million US $) of five companies in the year 2001. The percent profit or loss of a company is given by
% Profit/Loss = (Income - Expenditure)/Expenditure x 100
Income and Expenditure (in million US $) of five companies in the year 2001.

28.28
30.30
32.32
34.34
Correct answer is B
Let the income of Company Q in 2001 = x million US $.
Then, income of Company in 2001 = ( 110/100 x x ) million US $.
Therefore 110x/100 = 40 => x = ( 400/11 )
i.e., income of Company Q in 2000 = ( 400/11 ) million US $.
Let the expenditure of Company Q in 2000 be E million US $.
Then, 20 = [(400/11) - E]/E x 100 [because %Profit = 20% ]
=> 20 = [ ( 400/11E ) - 1 ] x 100
=> E = 400/11 x 100/120 = 30.30
Therefore Expenditure of Company Q in 2000 = 30.30 million US $.
The following bar graph shows the Income and Expenditures (in million US $) of five companies in the year 2001. The percent profit or loss of a company is given by
% Profit/Loss = (Income - Expenditure)/Expenditure x 100
Income and Expenditure (in million US $) of five companies in the year 2001.

35.75
37.25
38.5
41.25
Correct answer is D
Let the expenditure of Company R in 2000 be X million US $.
Then, expenditure of Company R in 2001 = ( (120/100) x x ) million US $
Therefore 120x/100 = 45 => x = 37.5
i.e., expenditure of Company R in 2000 = 37.5 million US $
Let the income of Company R in 2000 be I million US $.
Then, 10 = (I - 37.5)/37.5 x 100 [ ∵ %Profit in 2000 = 10%]
=> I - 37.5 = 3.75
=> I = 41.25
i.e., Income of Company R in 2000 = 41.25 million US $.
The following bar graph shows the Income and Expenditures (in million US $) of five companies in the year 2001. The percent profit or loss of a company is given by
% Profit/Loss = (Income - Expenditure)/Expenditure x 100
Income and Expenditure (in million US $) of five companies in the year 2001.

Which company earned the maximum percentage profit in the year 2001?
M
N
P
Q
Correct answer is D
The percentage profit/loss in the year 2001 for various comapanies are:
For M = [ (35 - 45)/45 x 100 ] % = -22.22% i.e., Loss = 22.22%
For N = [ (50 - 40)/40 x 100 ] % = 25% i.e., Profit = 25%
For P = [ (40 - 45)/45 x 100 ] % = -11.11% i.e., Loss = 11.11%
For Q = [ (40 - 30)/30 x 100 ] % = 33.33% i.e., Profit = 33.33%
For R = [ (50 - 45)/45 x 100 ] % = 11.11% i.e., Profit = 11.11%
Clearly, the Company Q earned the maximum profit in 2001.
The following bar graph shows the Income and Expenditures (in million US $) of five companies in the year 2001. The percent profit or loss of a company is given by
% Profit/Loss = (Income - Expenditure)/Expenditure x 100
Income and Expenditure (in million US $) of five companies in the year 2001.
5% profit
6.5% profit
4% loss
7% loss
Correct answer is A
Total income of all five companies
= (35 + 50 + 40 + 40 + 50) million US $
= 215 million US $.
Total expenditure of all five companies
= (45 + 40 + 45 + 30 + 45) million US $
= 205 million US $.
Therefore % Profit = [ (215 - 205)/205 x 100 ] % = 4.88% ≈ 5%
The following bar graph shows the Income and Expenditures (in million US $) of five companies in the year 2001. The percent profit or loss of a company is given by
% Profit/Loss = (Income - Expenditure)/Expenditure x 100
Income and Expenditure (in million US $) of five companies in the year 2001.

The companies M and N together had a percentage of profit/loss of?
12% loss
10% loss
10% profit
There was no loss or profit
Correct answer is D
Total income of Companies M and N together
= (35 + 50) million US $
= 85 million US $
Total expenditure of Companies M and N together
= (45 + 40) million US $
= 85 million US $.
Therefore Percent Profit/Loss of companies M and N together
% Profit/Loss = ( (85 - 85)/85 x 100 ) = 0%.
Thus, there was neither loss nor profit for companies M and N together.
Aptitude Tests