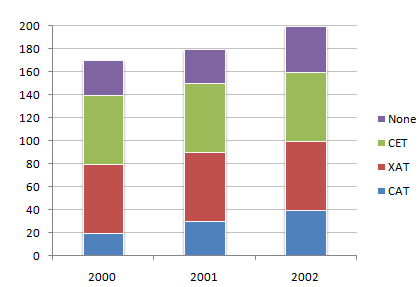
The following chart represents the number of students who passed the CAT exam or the XAT exam or the CET exam or None of these exams. (Assume that there are no students who passed more than one exam.)
Number of students who qualified for CAT/XAT/CET Exams

What was the percentage of students who succeeded in at least one of three exams in 2000 ?
82.4 %
82.8 %
82.35 %
83.3 %
Correct answer is C
Total percentage of students who succeeded in at least one of three exams in 2000 = (140 x 100)/170 = 82.35 %
The following chart represents the number of students who passed the CAT exam or the XAT exam or the CET exam or None of these exams. (Assume that there are no students who passed more than one exam.)
Number of students who qualified for CAT/XAT/CET Exams
2000
2001
2002
Cannot be determined
Correct answer is B
Compare the respective pass percentage for three years : 2000, 2001 and 2002
= (140 x 100)/170 < (150 x 100)/180 and (150 x 100)/180 > (160 x 100)/200
= 82.35% < 83.33% and 83.33% > 80%
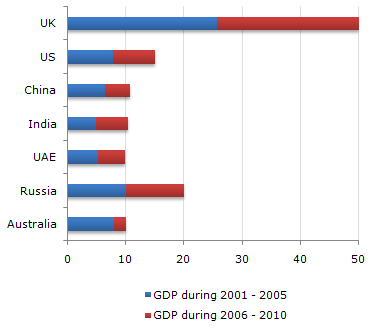
The following bar chart represents the GDP of different countries during the half decades 2001 - 2005 and 2006 - 2010. All figures are in Rs. billion.
GDP of Various Countries

Rs. 700
Rs. 1,400
Rs. 2,800
None of these
Correct answer is D
Russia will account for 10 out of 125, i.e, 8% of the total, i.e, 800 out of 10,000 (approximately values based on visual interpretation).
The following bar chart represents the GDP of different countries during the half decades 2001 - 2005 and 2006 - 2010. All figures are in Rs. billion.
GDP of Various Countries
Russia
China
India
UAE
Correct answer is A
It's clear that Russia is the answer.
The following bar chart represents the GDP of different countries during the half decades 2001 - 2005 and 2006 - 2010. All figures are in Rs. billion.
GDP of Various Countries

The GDP of UAE is what fraction of GDP of the UK for the decade (approximately) ?
(1/4)th
(1/5)th
(1/6)th
Data inadequate
Correct answer is B
(10/50) = 20% = (1/5)th
Aptitude Tests