The total of the first three deficit countries (in Rs. crores) = 3594.3. The total of next five deficit countries (in Rs. crores) = 2588.5. The total of the last five deficit countries (in Rs. crores) = 334.2.
Cumulative Trade Deficit/Surplus of Countries for the Year 2006 - 2007 (All figures in Rs. Crores).
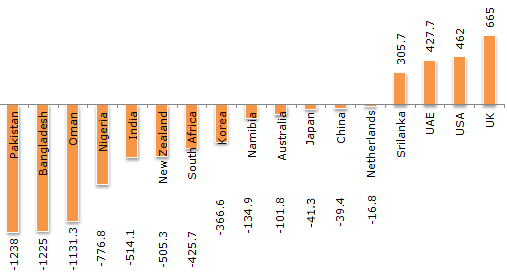
The net total deficit/surplus is equal to ?
4656.6 surplus
4656.6 deficit
3836.5 deficit
None of these
Correct answer is B
Adding all surpluses and subtracting all deficits will give an overall value of deficit of 4656.6
The total of the first three deficit countries (in Rs. crores) = 3594.3. The total of next five deficit countries (in Rs. crores) = 2588.5. The total of the last five deficit countries (in Rs. crores) = 334.2.
Cumulative Trade Deficit/Surplus of Countries for the Year 2006 - 2007 (All figures in Rs. Crores).

0.72
0.75
0.80
0.85
Correct answer is B
The required answer is (4885.2/6517) = 0.7496
The total of the first three deficit countries (in Rs. crores) = 3594.3. The total of next five deficit countries (in Rs. crores) = 2588.5. The total of the last five deficit countries (in Rs. crores) = 334.2.
Cumulative Trade Deficit/Surplus of Countries for the Year 2006 - 2007 (All figures in Rs. Crores).

The state whose surplus is nearly equal to the average of the four surplus countries is
Sri Lanka
UAE
USA
UK
Correct answer is C
The average trade surplus of the four countries is 1860.4/4 = 465.1. Of the four options, USA has the closest value.
The total of the first three deficit countries (in Rs. crores) = 3594.3. The total of next five deficit countries (in Rs. crores) = 2588.5. The total of the last five deficit countries (in Rs. crores) = 334.2.
Cumulative Trade Deficit/Surplus of Countries for the Year 2006 - 2007 (All figures in Rs. Crores).

Korea
South Africa
UAE
None of these
Correct answer is A
The middle five deficit countries are India, New Zealand, South Africa, Korea and Namibia.
Their average deficit is (1946.6/5) = 389.32. Korea's deficit is close to this value.
The total of the first three deficit countries (in Rs. crores) = 3594.3. The total of next five deficit countries (in Rs. crores) = 2588.5. The total of the last five deficit countries (in Rs. crores) = 334.2.
Cumulative Trade Deficit/Surplus of Countries for the Year 2006 - 2007 (All figures in Rs. Crores).

3.44
2.96
4.5
3.83
Correct answer is D
The required answer will be equal to 360/94 = 3.829
Aptitude Tests