Study the following bar charts and answer the questions.
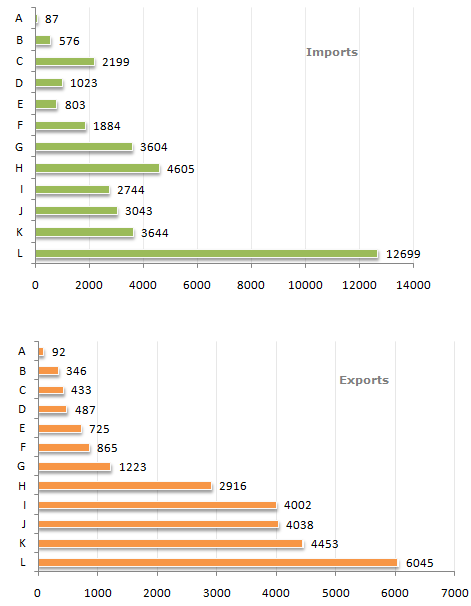
Foreign Trade (Imports and Exports) by countries for the year (1993 - 1994)
The ratio of Exports to Imports was highest for which country ?
A
I
J
K
Correct answer is B
I has a ratio of 4002/2744 = 1.45, which is the highest.
Study the following bar charts and answer the questions.
Foreign Trade (Imports and Exports) by countries for the year (1993 - 1994)

The highest trade deficit was shown by which country ?
C
G
H
L
Correct answer is D
Visually its clear that L has the highest trade deficit.
Study the following bar charts and answer the questions.
Foreign Trade (Imports and Exports) by countries for the year (1993 - 1994)

The total trade deficit/surplus for all the countries put together was ?
11286 surplus
11286 deficit
10286 deficit
None of these
Correct answer is B
Sum of exports - Sum of imports = deficit(11286).
Study the following bar charts and answer the questions.
Foreign Trade (Imports and Exports) by countries for the year (1993 - 1994)

How many countries exhibited a trade surplus ?
5
4
3
6
Correct answer is B
Out of a total of 12 countries, 8 showed a deficit while 4 showed a surplus.
Study the following bar charts and answer the questions.
Foreign Trade (Imports and Exports) by countries for the year (1993 - 1994)

The ratio of the maximum exports to the minimum imports was closest to ?
64
69
74
79
Correct answer is B
The value of maximum exports = 6045.
The value of minimum imports = 87.
Therefore, the required ratio (6045/87) = 69.48 = 69 (approximately).
Aptitude Tests