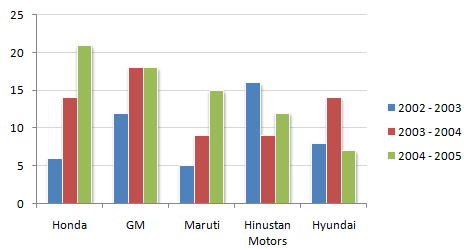
The following chart shows the production of cars in thousands.
Production of Cars for 2002 - 2005 period from the Selected Manufacturers
For how many companies has there been no decrease in production in any year from the previous year ?
One
Two
Three
Four
Correct answer is C
By visual inspection we can say that Honda, GM and Maruti have not shown a decrease.
The following chart shows the production of cars in thousands.
Production of Cars for 2002 - 2005 period from the Selected Manufacturers

The ratio of Hindustan Motors production in 2003 - 2004 to Honda's production in 2002 - 2003 is ?
0.66
1.5
2
None of these
Correct answer is B
The required ratio is (9/6) = 1.5
The following chart shows the production of cars in thousands.
Production of Cars for 2002 - 2005 period from the Selected Manufacturers

One
Two
Three
Four
Correct answer is C
Average sales of company:
Honda = (6 + 14 + 21)/3 = 13.66
GM = (12 + 18 + 18)/3 = 16
Maruti = (5 + 9 + 15)/3 = 9.66
Hindustan Motors= (16 + 9 + 12)/3 = 12.33
Hyundai = (8 + 14 + 7)/3 = 9.66
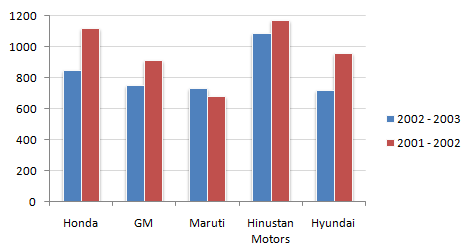
Study the following bar chart and answer the questions carefully.
Sales Turnover of 5 Companies (in Rs. crores)

133.45
142.48
117.6
None of these
Correct answer is B
Difference between the sum of the two years divided by 5.
Study the following bar chart and answer the questions carefully.
Sales Turnover of 5 Companies (in Rs. crores)
953.76
963.76
952.76
962.76
Correct answer is D
GM should have increased its sales turnover by Rs.49.13 crore. Hence, the answer is 913.63 + 49.13 = 962.76.
Aptitude Tests